Counties with the shortest life expectancy in Alabama
Published 10:56 pm Wednesday, December 21, 2022
Canva
Counties with the shortest life expectancy in Alabama
Life expectancy in the United States has generally been on the rise. Between 1960 and 2019, the life expectancy of Americans rose by roughly a decade to the age of 79. Greater longevity can be attributed to improved health care such as diagnostic and medical advancements, as well as healthier lifestyle choices relating to diet, smoking, and alcohol consumption.
Since 2020, however, life expectancy has started to decline. The opioid epidemic, COVID-19, and unintentional injuries—largely driven by drug overdoses—were the leading causes of a three-year decrease in life expectancy over the last two years. Stark disparities among certain segments of the population have also been observed. American Indians/Alaska Natives saw a life expectancy decrease of more than six years; Hispanic and Black Americans, a drop of four years; and white and Asian Americans, a decrease of about two years.
While no one single factor determines the overall health of an entire community, certain socioeconomic and environmental factors such as access to health care, substance abuse treatments, clean air, clean water, and affordable housing contribute significantly to the general health and wellbeing of the entire population.
Using 2022 County Health Rankings & Roadmaps from the University of Wisconsin Population Health Institute, Stacker identified counties with the shortest life expectancy in Alabama. Life expectancy measures the average number of years from birth a person can expect to live, and is calculated based on the number of deaths in a given time period and the average number of people at risk of dying during that period. Counties with unreliable or insufficient data were excluded from the analysis. Mortality data came from the National Vital Statistics System.
![]()

Rudi Weikard // Wikimedia Commons
#50. St. Clair County
– Average life expectancy: 74.7 years (0.1 less than the statewide average)
– Health outcomes statewide rank: #11
— Length of life rank: #12
— Quality of life rank: #11

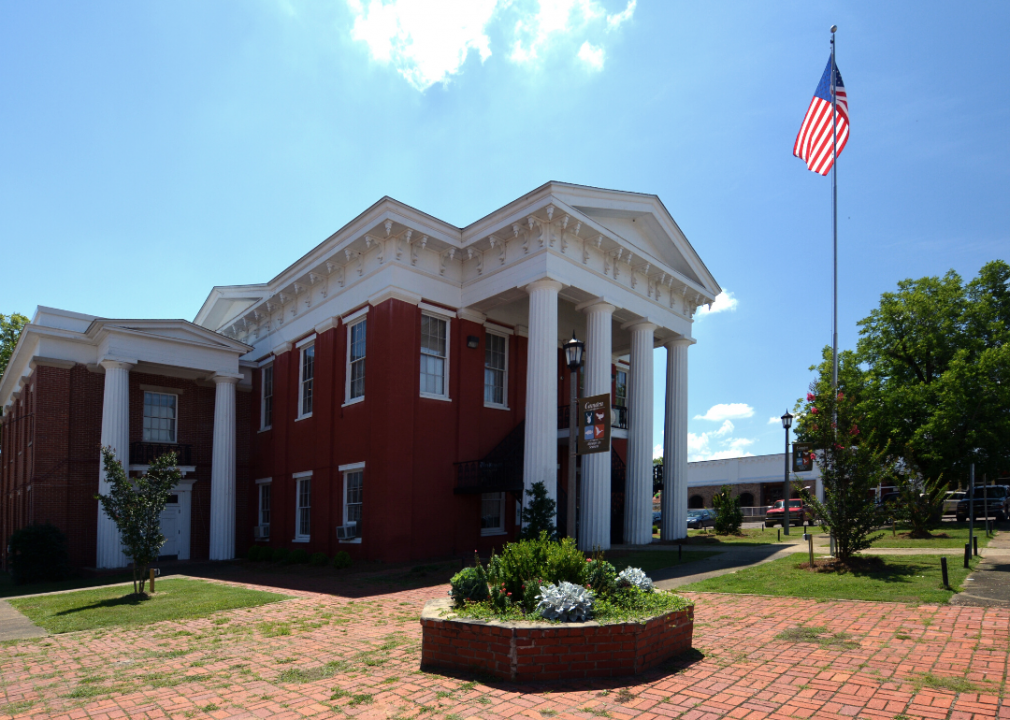
Altairisfar // Wikicommons
#48. Mobile County
– Average life expectancy: 74.4 years (0.4 less than the statewide average)
– Health outcomes statewide rank: #27
— Length of life rank: #28
— Quality of life rank: #31

Canva
#48. Chilton County
– Average life expectancy: 74.4 years (0.4 less than the statewide average)
– Health outcomes statewide rank: #22
— Length of life rank: #16
— Quality of life rank: #29

Rivers Langley; SaveRivers // Wikimedia Commons
#47. Cleburne County
– Average life expectancy: 74.3 years (0.5 less than the statewide average)
– Health outcomes statewide rank: #17
— Length of life rank: #20
— Quality of life rank: #17

RuralSWAlabama (Billy Milstead) // Wikimedia Commons
#44. Choctaw County
– Average life expectancy: 74.2 years (0.6 less than the statewide average)
– Health outcomes statewide rank: #49
— Length of life rank: #44
— Quality of life rank: #49

Rudi Weikard // Wikimedia Commons
#44. Blount County
– Average life expectancy: 74.2 years (0.6 less than the statewide average)
– Health outcomes statewide rank: #15
— Length of life rank: #24
— Quality of life rank: #13

MPearsallArt // Wikimedia Commons
#44. Morgan County
– Average life expectancy: 74.2 years (0.6 less than the statewide average)
– Health outcomes statewide rank: #13
— Length of life rank: #25
— Quality of life rank: #9

M Floyd // Flickr
#43. Jefferson County
– Average life expectancy: 74.1 years (0.7 less than the statewide average)
– Health outcomes statewide rank: #19
— Length of life rank: #36
— Quality of life rank: #10

Rudi Weikard // Wikimedia Commons
#42. Cherokee County
– Average life expectancy: 74 years (0.8 less than the statewide average)
– Health outcomes statewide rank: #28
— Length of life rank: #33
— Quality of life rank: #23

Rivers A. Langley; SaveRivers // Wikimedia Commons
#34. Coosa County
– Average life expectancy: 73.9 years (0.9 less than the statewide average)
– Health outcomes statewide rank: #53
— Length of life rank: #55
— Quality of life rank: #53

Rivers A. Langley; SaveRivers // Wikimedia Commons
#34. Tallapoosa County
– Average life expectancy: 73.9 years (0.9 less than the statewide average)
– Health outcomes statewide rank: #47
— Length of life rank: #35
— Quality of life rank: #51

Public Domain
#34. Pickens County
– Average life expectancy: 73.9 years (0.9 less than the statewide average)
– Health outcomes statewide rank: #42
— Length of life rank: #22
— Quality of life rank: #56

Kreeder13 // Wikimedia Commons
#34. Pike County
– Average life expectancy: 73.9 years (0.9 less than the statewide average)
– Health outcomes statewide rank: #32
— Length of life rank: #39
— Quality of life rank: #28

Rivers A. Langley; SaveRivers // Wikimedia Commons
#34. Randolph County
– Average life expectancy: 73.9 years (0.9 less than the statewide average)
– Health outcomes statewide rank: #26
— Length of life rank: #38
— Quality of life rank: #20

Dailynetworks // Wikimedia Commons
#34. Colbert County
– Average life expectancy: 73.9 years (0.9 less than the statewide average)
– Health outcomes statewide rank: #24
— Length of life rank: #30
— Quality of life rank: #22

Canva
#34. Marshall County
– Average life expectancy: 73.9 years (0.9 less than the statewide average)
– Health outcomes statewide rank: #18
— Length of life rank: #18
— Quality of life rank: #18

Chris Pruitt // Wikimedia Commons
#34. Cullman County
– Average life expectancy: 73.9 years (0.9 less than the statewide average)
– Health outcomes statewide rank: #16
— Length of life rank: #21
— Quality of life rank: #16

Canva
#31. Bullock County
– Average life expectancy: 73.8 years (1.0 less than the statewide average)
– Health outcomes statewide rank: #51
— Length of life rank: #34
— Quality of life rank: #63

Rivers Langley; SaveRivers // Wikimedia Commons
#31. Chambers County
– Average life expectancy: 73.8 years (1.0 less than the statewide average)
– Health outcomes statewide rank: #39
— Length of life rank: #29
— Quality of life rank: #47

Canva
#31. DeKalb County
– Average life expectancy: 73.8 years (1.0 less than the statewide average)
– Health outcomes statewide rank: #30
— Length of life rank: #26
— Quality of life rank: #40

Rudi Weikard // Wikimedia Commons
#30. Franklin County
– Average life expectancy: 73.7 years (1.1 less than the statewide average)
– Health outcomes statewide rank: #25
— Length of life rank: #27
— Quality of life rank: #30

Canva
#29. Bibb County
– Average life expectancy: 73.6 years (1.2 less than the statewide average)
– Health outcomes statewide rank: #31
— Length of life rank: #31
— Quality of life rank: #35

Chris Pruitt // Wikimedia Commons
#28. Butler County
– Average life expectancy: 73.5 years (1.3 less than the statewide average)
– Health outcomes statewide rank: #52
— Length of life rank: #51
— Quality of life rank: #54

Rivers Langley SaveRivers // Wikimedia Commons
#27. Russell County
– Average life expectancy: 73.4 years (1.4 less than the statewide average)
– Health outcomes statewide rank: #34
— Length of life rank: #37
— Quality of life rank: #34

Carol M. Highsmith // Wikimedia Commons
#25. Monroe County
– Average life expectancy: 73.3 years (1.5 less than the statewide average)
– Health outcomes statewide rank: #54
— Length of life rank: #56
— Quality of life rank: #52

Springfieldohio // Wikimedia Commons
#25. Jackson County
– Average life expectancy: 73.3 years (1.5 less than the statewide average)
– Health outcomes statewide rank: #35
— Length of life rank: #32
— Quality of life rank: #37

Canva
#23. Fayette County
– Average life expectancy: 73.1 years (1.7 less than the statewide average)
– Health outcomes statewide rank: #46
— Length of life rank: #47
— Quality of life rank: #42

Rudi Weikard // Wikimedia Commons
#23. Marion County
– Average life expectancy: 73.1 years (1.7 less than the statewide average)
– Health outcomes statewide rank: #38
— Length of life rank: #41
— Quality of life rank: #36

Canva
#17. Greene County
– Average life expectancy: 72.9 years (1.9 less than the statewide average)
– Health outcomes statewide rank: #66
— Length of life rank: #59
— Quality of life rank: #67

Rivers Langley; SaveRivers // Wikimedia Commons
#17. Barbour County
– Average life expectancy: 72.9 years (1.9 less than the statewide average)
– Health outcomes statewide rank: #56
— Length of life rank: #52
— Quality of life rank: #60

Rivers Langley; SaveRivers // Wikimedia Commons
#17. Talladega County
– Average life expectancy: 72.9 years (1.9 less than the statewide average)
– Health outcomes statewide rank: #48
— Length of life rank: #46
— Quality of life rank: #44

JNix // Shutterstock
#17. Clay County
– Average life expectancy: 72.9 years (1.9 less than the statewide average)
– Health outcomes statewide rank: #45
— Length of life rank: #48
— Quality of life rank: #39

Canva
#17. Lawrence County
– Average life expectancy: 72.9 years (1.9 less than the statewide average)
– Health outcomes statewide rank: #44
— Length of life rank: #49
— Quality of life rank: #33

Chris Pruitt // Wikimedia Commons
#17. Covington County
– Average life expectancy: 72.9 years (1.9 less than the statewide average)
– Health outcomes statewide rank: #40
— Length of life rank: #43
— Quality of life rank: #38

Rivers Langley; SaveRivers // Wikimedia Commons
#16. Calhoun County
– Average life expectancy: 72.8 years (2.0 less than the statewide average)
– Health outcomes statewide rank: #29
— Length of life rank: #40
— Quality of life rank: #21

Rivers Langley; SaveRivers // Wikimedia Commons
#14. Crenshaw County
– Average life expectancy: 72.6 years (2.2 less than the statewide average)
– Health outcomes statewide rank: #43
— Length of life rank: #42
— Quality of life rank: #41

Wmr36104 // Wikimedia Commons
#14. Geneva County
– Average life expectancy: 72.6 years (2.2 less than the statewide average)
– Health outcomes statewide rank: #41
— Length of life rank: #50
— Quality of life rank: #27

Carol M. Highsmith // Wikimedia Commons
#12. Hale County
– Average life expectancy: 72.5 years (2.3 less than the statewide average)
– Health outcomes statewide rank: #55
— Length of life rank: #54
— Quality of life rank: #57

Prestinian // Wikimedia Commons
#12. Etowah County
– Average life expectancy: 72.5 years (2.3 less than the statewide average)
– Health outcomes statewide rank: #33
— Length of life rank: #45
— Quality of life rank: #19

Canva
#11. Escambia County
– Average life expectancy: 72.2 years (2.6 less than the statewide average)
– Health outcomes statewide rank: #50
— Length of life rank: #53
— Quality of life rank: #46

Canva
#10. Sumter County
– Average life expectancy: 71.9 years (2.9 less than the statewide average)
– Health outcomes statewide rank: #61
— Length of life rank: #60
— Quality of life rank: #61

Altairisfar // Wikimedia Commons
#9. Clarke County
– Average life expectancy: 71.7 years (3.1 less than the statewide average)
– Health outcomes statewide rank: #60
— Length of life rank: #57
— Quality of life rank: #58

Mccallk69 // Shutterstock
#8. Macon County
– Average life expectancy: 71.3 years (3.5 less than the statewide average)
– Health outcomes statewide rank: #59
— Length of life rank: #58
— Quality of life rank: #55

Chris Pruitt // Wikimedia Commons
#7. Conecuh County
– Average life expectancy: 71.2 years (3.6 less than the statewide average)
– Health outcomes statewide rank: #63
— Length of life rank: #63
— Quality of life rank: #59

DXR // Wikimedia Commons
#6. Dallas County
– Average life expectancy: 71.1 years (3.7 less than the statewide average)
– Health outcomes statewide rank: #62
— Length of life rank: #61
— Quality of life rank: #62

Canva
#5. Marengo County
– Average life expectancy: 71 years (3.8 less than the statewide average)
– Health outcomes statewide rank: #57
— Length of life rank: #62
— Quality of life rank: #48

Canva
#4. Perry County
– Average life expectancy: 70.8 years (4.0 less than the statewide average)
– Health outcomes statewide rank: #64
— Length of life rank: #65
— Quality of life rank: #65

Altairisfar // Wikimedia Commons
#3. Lowndes County
– Average life expectancy: 70.3 years (4.5 less than the statewide average)
– Health outcomes statewide rank: #65
— Length of life rank: #66
— Quality of life rank: #64

Canva
#2. Wilcox County
– Average life expectancy: 69.8 years (5.0 less than the statewide average)
– Health outcomes statewide rank: #67
— Length of life rank: #67
— Quality of life rank: #66

Canva
#1. Walker County
– Average life expectancy: 69.6 years (5.2 less than the statewide average)
– Health outcomes statewide rank: #58
— Length of life rank: #64
— Quality of life rank: #43