Counties with the oldest homes in Alabama
Published 12:01 pm Saturday, August 27, 2022
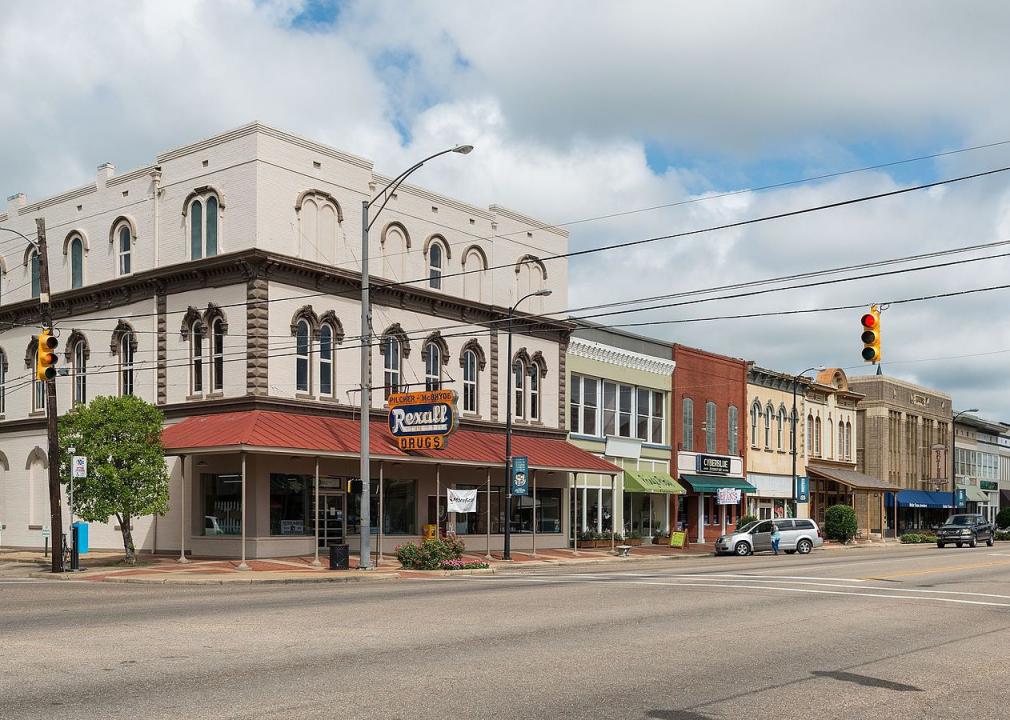
DXR // Wikimedia Commons
Counties with the oldest homes in Alabama
There’s an undeniable charm that comes with pre-World War II American architecture, characterized by high ceilings, crown molding, hardwood floors, and ornate details. In fact, 12.8% of all housing units in America were built in 1939 or before, showing the popularity of the preservation of these units. Owning a piece of history can sometimes come with a cost: Many old homes come with asbestos, lead piping, knob-and-tube wiring, and other outdated building styles that can rack up a hefty price tag to modernize. However, with more and more modernized pre-war homes on the market, generally located just outside bustling downtown metros, investing in property that has withstood the test of time is an attractive prospect.
Stacker compiled a list of the counties in Alabama with the oldest homes using data from the U.S. Census Bureau. Counties are ranked by median year the structure was built according to 2020 5-year estimates. Ties broken by the highest percentage of homes built before 1939.
The country’s domestic architecture is perhaps best characterized by a rugged individualism as opposed to the hybridization of disparate architectural elements. As Maya Angelou once perceptively observed, “the ache for home lives in all of us,” a phrase that has meant very different things to different people.
Modest or palatial, there is no shortage of noteworthy homes in the U.S. Log cabins constructed by industrious pioneers have dotted the landscape alongside traditional Native American dwellings ever since immigrant Swedes introduced them to the New World in 1638. The unprecedented personal fortunes amassed by the so-called “Robber Barons” at the close of the 19th century gave way to the construction of a staggering number of Gilded Age estates.
The ravages of time spared neither the sumptuous nor the humble. Stately mansions, often prohibitively costly to maintain in the modern era, were frequently neglected; simple structures were forgotten, discarded by their owners, and damaged by natural elements. However, the tireless efforts of architectural preservationists and local historical societies have saved many of these homes from demolition, leading to their inclusion in the National Register of Historic Places and thereby safeguarding them for future generations.
Keep reading to learn more about which counties in Alabama have the oldest homes.
You may also like: Cities with the most expensive homes in Alabama
![]()

Rivers A. Langley; SaveRivers // Wikimedia Commons
#50. Randolph County
– Median year homes built: 1986
– Homes built 1939 or earlier: 7.8% (948 homes)
– Homes built since 2000: 24.1% (2,923 homes)
– Total homes built: 12,147

Rivers Langley; SaveRivers // Wikimedia Commons
#49. Cleburne County
– Median year homes built: 1985
– Homes built 1939 or earlier: 5.6% (381 homes)
– Homes built since 2000: 22.6% (1,553 homes)
– Total homes built: 6,859

Canva
#48. Wilcox County
– Median year homes built: 1985
– Homes built 1939 or earlier: 5.7% (333 homes)
– Homes built since 2000: 16.8% (975 homes)
– Total homes built: 5,804

Kreeder13 // Wikimedia Commons
#47. Pike County
– Median year homes built: 1985
– Homes built 1939 or earlier: 6.0% (967 homes)
– Homes built since 2000: 25.6% (4,161 homes)
– Total homes built: 16,241

Canva
#46. Chilton County
– Median year homes built: 1985
– Homes built 1939 or earlier: 6.8% (1,351 homes)
– Homes built since 2000: 24.8% (4,942 homes)
– Total homes built: 19,897
You may also like: Alabama is the #7 state with the lowest Black homeownership gap

Idawriter // Wikimedia Commons
#45. Washington County
– Median year homes built: 1984
– Homes built 1939 or earlier: 1.9% (166 homes)
– Homes built since 2000: 20.8% (1,788 homes)
– Total homes built: 8,603

Carol M. Highsmith // Wikimedia Commons
#44. Monroe County
– Median year homes built: 1984
– Homes built 1939 or earlier: 3.4% (392 homes)
– Homes built since 2000: 15.5% (1,772 homes)
– Total homes built: 11,451

Rivers Langley SaveRivers // Wikimedia Commons
#43. Russell County
– Median year homes built: 1984
– Homes built 1939 or earlier: 4.2% (1,161 homes)
– Homes built since 2000: 25.9% (7,224 homes)
– Total homes built: 27,912

Chris Pruitt // Wikimedia Commons
#42. Cullman County
– Median year homes built: 1984
– Homes built 1939 or earlier: 5.8% (2,214 homes)
– Homes built since 2000: 19.3% (7,352 homes)
– Total homes built: 38,056

Carol M. Highsmith // Wikimedia Commons
#41. Hale County
– Median year homes built: 1984
– Homes built 1939 or earlier: 5.9% (462 homes)
– Homes built since 2000: 18.7% (1,465 homes)
– Total homes built: 7,847
You may also like: Best public high schools in Alabama

Carol M. Highsmith/Library of Congress // Wikimedia Commons
#40. Houston County
– Median year homes built: 1983
– Homes built 1939 or earlier: 2.9% (1,395 homes)
– Homes built since 2000: 23.2% (11,071 homes)
– Total homes built: 47,798

Calvin Beale // Wikimedia Commons
#39. Coffee County
– Median year homes built: 1983
– Homes built 1939 or earlier: 3.2% (743 homes)
– Homes built since 2000: 25.1% (5,851 homes)
– Total homes built: 23,313

Canva
#38. Marshall County
– Median year homes built: 1983
– Homes built 1939 or earlier: 4.3% (1,768 homes)
– Homes built since 2000: 19.5% (7,917 homes)
– Total homes built: 40,661

Canva
#37. DeKalb County
– Median year homes built: 1983
– Homes built 1939 or earlier: 6.0% (1,883 homes)
– Homes built since 2000: 18.7% (5,871 homes)
– Total homes built: 31,424

Rivers A. Langley; SaveRivers // Wikimedia Commons
#36. Coosa County
– Median year homes built: 1983
– Homes built 1939 or earlier: 6.6% (439 homes)
– Homes built since 2000: 16.7% (1,106 homes)
– Total homes built: 6,615
You may also like: Highest rated beer in Alabama

Canva
#35. Bibb County
– Median year homes built: 1983
– Homes built 1939 or earlier: 6.7% (619 homes)
– Homes built since 2000: 20.1% (1,856 homes)
– Total homes built: 9,237

Rivers Langley; SaveRivers // Wikimedia Commons
#34. Henry County
– Median year homes built: 1983
– Homes built 1939 or earlier: 7.0% (643 homes)
– Homes built since 2000: 20.3% (1,867 homes)
– Total homes built: 9,203

Chris Pruitt // Wikimedia Commons
#33. Covington County
– Median year homes built: 1983
– Homes built 1939 or earlier: 7.1% (1,346 homes)
– Homes built since 2000: 12.5% (2,386 homes)
– Total homes built: 19,073

MPearsallArt // Wikimedia Commons
#32. Morgan County
– Median year homes built: 1982
– Homes built 1939 or earlier: 4.0% (2,068 homes)
– Homes built since 2000: 18.7% (9,759 homes)
– Total homes built: 52,248

Altairisfar // Wikimedia Commons
#31. Clarke County
– Median year homes built: 1982
– Homes built 1939 or earlier: 4.5% (580 homes)
– Homes built since 2000: 16.8% (2,147 homes)
– Total homes built: 12,813
You may also like: Countries Alabama exports the most goods to

Public Domain
#30. Pickens County
– Median year homes built: 1982
– Homes built 1939 or earlier: 4.5% (437 homes)
– Homes built since 2000: 16.2% (1,554 homes)
– Total homes built: 9,620

Michael Rivera // Wikimedia Commons
#29. Dale County
– Median year homes built: 1982
– Homes built 1939 or earlier: 4.6% (1,059 homes)
– Homes built since 2000: 18.1% (4,191 homes)
– Total homes built: 23,151

Rudi Weikard // Wikimedia Commons
#28. Franklin County
– Median year homes built: 1982
– Homes built 1939 or earlier: 4.7% (660 homes)
– Homes built since 2000: 17.8% (2,500 homes)
– Total homes built: 14,082

Canva
#27. Sumter County
– Median year homes built: 1982
– Homes built 1939 or earlier: 5.2% (358 homes)
– Homes built since 2000: 14.5% (1,002 homes)
– Total homes built: 6,917

Canva
#26. Walker County
– Median year homes built: 1982
– Homes built 1939 or earlier: 6.0% (1,860 homes)
– Homes built since 2000: 18.9% (5,901 homes)
– Total homes built: 31,238
You may also like: Highest-rated museums in Alabama

Rivers A. Langley; SaveRivers // Wikimedia Commons
#25. Tallapoosa County
– Median year homes built: 1982
– Homes built 1939 or earlier: 6.2% (1,406 homes)
– Homes built since 2000: 17.1% (3,850 homes)
– Total homes built: 22,565

Canva
#24. Marengo County
– Median year homes built: 1982
– Homes built 1939 or earlier: 7.3% (756 homes)
– Homes built since 2000: 15.5% (1,606 homes)
– Total homes built: 10,377

Springfieldohio // Wikimedia Commons
#23. Jackson County
– Median year homes built: 1981
– Homes built 1939 or earlier: 6.2% (1,563 homes)
– Homes built since 2000: 14.5% (3,657 homes)
– Total homes built: 25,135

Rivers Langley; SaveRivers // Wikimedia Commons
#22. Talladega County
– Median year homes built: 1981
– Homes built 1939 or earlier: 6.9% (2,607 homes)
– Homes built since 2000: 18.5% (7,017 homes)
– Total homes built: 38,021

Rudi Weikard // Wikimedia Commons
#21. Marion County
– Median year homes built: 1980
– Homes built 1939 or earlier: 3.2% (478 homes)
– Homes built since 2000: 12.9% (1,905 homes)
– Total homes built: 14,754
You may also like: Cities in Alabama with the most living in poverty

Wmr36104 // Wikimedia Commons
#20. Geneva County
– Median year homes built: 1980
– Homes built 1939 or earlier: 6.1% (789 homes)
– Homes built since 2000: 19.0% (2,455 homes)
– Total homes built: 12,901

Rivers Langley; SaveRivers // Wikimedia Commons
#19. Crenshaw County
– Median year homes built: 1980
– Homes built 1939 or earlier: 6.6% (452 homes)
– Homes built since 2000: 17.6% (1,202 homes)
– Total homes built: 6,834

Canva
#18. Greene County
– Median year homes built: 1980
– Homes built 1939 or earlier: 6.6% (340 homes)
– Homes built since 2000: 8.7% (446 homes)
– Total homes built: 5,131

Rivers Langley; SaveRivers // Wikimedia Commons
#17. Barbour County
– Median year homes built: 1980
– Homes built 1939 or earlier: 8.0% (964 homes)
– Homes built since 2000: 11.8% (1,419 homes)
– Total homes built: 12,057

RuralSWAlabama (Billy Milstead) // Wikimedia Commons
#16. Choctaw County
– Median year homes built: 1979
– Homes built 1939 or earlier: 2.0% (145 homes)
– Homes built since 2000: 13.8% (1,025 homes)
– Total homes built: 7,410
You may also like: Most popular girl names in the 60s in Alabama

Altairisfar // Wikicommons
#15. Mobile County
– Median year homes built: 1979
– Homes built 1939 or earlier: 4.0% (7,362 homes)
– Homes built since 2000: 18.1% (33,285 homes)
– Total homes built: 184,321

Chris Pruitt // wikicommons
#14. Montgomery County
– Median year homes built: 1979
– Homes built 1939 or earlier: 6.4% (6,682 homes)
– Homes built since 2000: 17.9% (18,837 homes)
– Total homes built: 105,063

Canva
#13. Fayette County
– Median year homes built: 1979
– Homes built 1939 or earlier: 7.2% (612 homes)
– Homes built since 2000: 14.8% (1,253 homes)
– Total homes built: 8,493

Chris Pruitt // Wikimedia Commons
#12. Butler County
– Median year homes built: 1979
– Homes built 1939 or earlier: 7.8% (786 homes)
– Homes built since 2000: 7.8% (792 homes)
– Total homes built: 10,119

JNix // Shutterstock
#11. Clay County
– Median year homes built: 1979
– Homes built 1939 or earlier: 11.7% (796 homes)
– Homes built since 2000: 16.8% (1,149 homes)
– Total homes built: 6,832
You may also like: Counties with the most veterans in Alabama

Wayne James // Shutterstock
#10. Lauderdale County
– Median year homes built: 1978
– Homes built 1939 or earlier: 5.5% (2,477 homes)
– Homes built since 2000: 17.2% (7,798 homes)
– Total homes built: 45,272

Mccallk69 // Shutterstock
#9. Macon County
– Median year homes built: 1978
– Homes built 1939 or earlier: 5.5% (566 homes)
– Homes built since 2000: 10.7% (1,105 homes)
– Total homes built: 10,311

Rivers Langley; SaveRivers // Wikimedia Commons
#8. Calhoun County
– Median year homes built: 1978
– Homes built 1939 or earlier: 5.7% (3,079 homes)
– Homes built since 2000: 16.3% (8,734 homes)
– Total homes built: 53,722

Rivers Langley; SaveRivers // Wikimedia Commons
#7. Chambers County
– Median year homes built: 1978
– Homes built 1939 or earlier: 11.2% (1,907 homes)
– Homes built since 2000: 18.8% (3,195 homes)
– Total homes built: 16,985

Canva
#6. Perry County
– Median year homes built: 1977
– Homes built 1939 or earlier: 5.3% (254 homes)
– Homes built since 2000: 10.9% (520 homes)
– Total homes built: 4,759
You may also like: Highest-rated specialty museums in Alabama, according to Tripadvisor

Dailynetworks // Wikimedia Commons
#5. Colbert County
– Median year homes built: 1977
– Homes built 1939 or earlier: 7.3% (1,953 homes)
– Homes built since 2000: 21.4% (5,719 homes)
– Total homes built: 26,727

Myself – Nathon Morris // Wikimedia Commons
#4. Lamar County
– Median year homes built: 1976
– Homes built 1939 or earlier: 6.1% (453 homes)
– Homes built since 2000: 14.3% (1,062 homes)
– Total homes built: 7,410

M Floyd // Flickr
#3. Jefferson County
– Median year homes built: 1974
– Homes built 1939 or earlier: 9.7% (29,884 homes)
– Homes built since 2000: 16.4% (50,704 homes)
– Total homes built: 308,825

DXR // Wikimedia Commons
#2. Dallas County
– Median year homes built: 1974
– Homes built 1939 or earlier: 12.1% (2,469 homes)
– Homes built since 2000: 11.8% (2,415 homes)
– Total homes built: 20,427

Prestinian // Wikimedia Commons
#1. Etowah County
– Median year homes built: 1973
– Homes built 1939 or earlier: 8.8% (4,183 homes)
– Homes built since 2000: 14.3% (6,848 homes)
– Total homes built: 47,805
You may also like: Countries Alabama imports the most goods from