Counties in Alabama with the most pre-war homes
Published 1:05 pm Wednesday, June 22, 2022
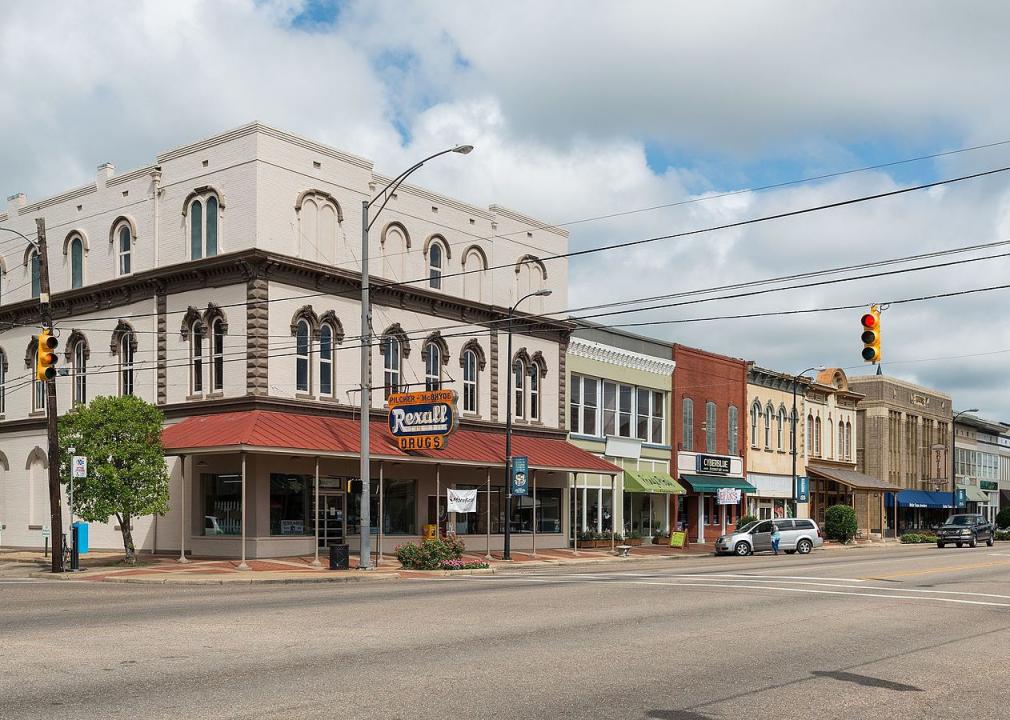
DXR // Wikimedia Commons
Counties in Alabama with the most pre-war homes
Pre-war homes—those built before 1939—are architectural gems. They are sturdy, charming, and often what people are referring to when they look at the prevalent colorless, linear designs of today and lament “they just don’t make them like they used to.”
In some ways, that’s a good thing. Pre-war homes often contained materials we know to be hazardous today, like asbestos and lead. But their signature characteristics, including hardwood floors, nickel accents, ornate crown molding, and high ceilings, are among the features many people look for in a dream home.
Preserving the history of these properties, many of which you’ll find on the National Register of Historic Places, is labor that often extends beyond the scope of an individual homeowner. Depending on where these homes are located, special permission by local historic commissions may be required before renovations can be done in an effort to preserve their historic architectural integrity.
Stacker compiled a list of counties in Alabama with the most pre-war homes using data from the U.S. Census Bureau. Counties are ranked by the highest percent of homes that were built before 1939 based on 2020 5-year estimates.
You may also like: Most popular baby names for boys in Alabama
![]()

Chris Pruitt // Wikimedia Commons
#30. Cullman County
– Homes built before 1939: 5.8%
– Homes built since 2000: 19.3%
– Median year built: 1984
– Total homes: 38,056

Carol M. Highsmith // Wikimedia Commons
#29. Hale County
– Homes built before 1939: 5.9%
– Homes built since 2000: 18.7%
– Median year built: 1984
– Total homes: 7,847

Kreeder13 // Wikimedia Commons
#28. Pike County
– Homes built before 1939: 6.0%
– Homes built since 2000: 25.6%
– Median year built: 1985
– Total homes: 16,241

Canva
#27. Walker County
– Homes built before 1939: 6.0%
– Homes built since 2000: 18.9%
– Median year built: 1982
– Total homes: 31,238

Canva
#26. DeKalb County
– Homes built before 1939: 6.0%
– Homes built since 2000: 18.7%
– Median year built: 1983
– Total homes: 31,424
You may also like: Best community colleges in Alabama

Myself – Nathon Morris // Wikimedia Commons
#25. Lamar County
– Homes built before 1939: 6.1%
– Homes built since 2000: 14.3%
– Median year built: 1976
– Total homes: 7,410

Wmr36104 // Wikimedia Commons
#24. Geneva County
– Homes built before 1939: 6.1%
– Homes built since 2000: 19.0%
– Median year built: 1980
– Total homes: 12,901

Springfieldohio // Wikimedia Commons
#23. Jackson County
– Homes built before 1939: 6.2%
– Homes built since 2000: 14.5%
– Median year built: 1981
– Total homes: 25,135

Rivers A. Langley; SaveRivers // Wikimedia Commons
#22. Tallapoosa County
– Homes built before 1939: 6.2%
– Homes built since 2000: 17.1%
– Median year built: 1982
– Total homes: 22,565

Chris Pruitt // wikicommons
#21. Montgomery County
– Homes built before 1939: 6.4%
– Homes built since 2000: 17.9%
– Median year built: 1979
– Total homes: 105,063
You may also like: Highest-earning counties in Alabama

Rivers Langley; SaveRivers // Wikimedia Commons
#20. Crenshaw County
– Homes built before 1939: 6.6%
– Homes built since 2000: 17.6%
– Median year built: 1980
– Total homes: 6,834

Canva
#19. Greene County
– Homes built before 1939: 6.6%
– Homes built since 2000: 8.7%
– Median year built: 1980
– Total homes: 5,131

Rivers A. Langley; SaveRivers // Wikimedia Commons
#18. Coosa County
– Homes built before 1939: 6.6%
– Homes built since 2000: 16.7%
– Median year built: 1983
– Total homes: 6,615

Canva
#17. Bibb County
– Homes built before 1939: 6.7%
– Homes built since 2000: 20.1%
– Median year built: 1983
– Total homes: 9,237

Canva
#16. Chilton County
– Homes built before 1939: 6.8%
– Homes built since 2000: 24.8%
– Median year built: 1985
– Total homes: 19,897
You may also like: Alabama is the #6 state where delivery drivers are paid the least

Rivers Langley; SaveRivers // Wikimedia Commons
#15. Talladega County
– Homes built before 1939: 6.9%
– Homes built since 2000: 18.5%
– Median year built: 1981
– Total homes: 38,021

Rivers Langley; SaveRivers // Wikimedia Commons
#14. Henry County
– Homes built before 1939: 7.0%
– Homes built since 2000: 20.3%
– Median year built: 1983
– Total homes: 9,203

Chris Pruitt // Wikimedia Commons
#13. Covington County
– Homes built before 1939: 7.1%
– Homes built since 2000: 12.5%
– Median year built: 1983
– Total homes: 19,073

Canva
#12. Bullock County
– Homes built before 1939: 7.1%
– Homes built since 2000: 18.0%
– Median year built: 1987
– Total homes: 4,591

Canva
#11. Fayette County
– Homes built before 1939: 7.2%
– Homes built since 2000: 14.8%
– Median year built: 1979
– Total homes: 8,493
You may also like: Counties with the lowest hospital bed capacity in Alabama

Canva
#10. Marengo County
– Homes built before 1939: 7.3%
– Homes built since 2000: 15.5%
– Median year built: 1982
– Total homes: 10,377

Dailynetworks // Wikimedia Commons
#9. Colbert County
– Homes built before 1939: 7.3%
– Homes built since 2000: 21.4%
– Median year built: 1977
– Total homes: 26,727

Chris Pruitt // Wikimedia Commons
#8. Butler County
– Homes built before 1939: 7.8%
– Homes built since 2000: 7.8%
– Median year built: 1979
– Total homes: 10,119

Rivers A. Langley; SaveRivers // Wikimedia Commons
#7. Randolph County
– Homes built before 1939: 7.8%
– Homes built since 2000: 24.1%
– Median year built: 1986
– Total homes: 12,147

Rivers Langley; SaveRivers // Wikimedia Commons
#6. Barbour County
– Homes built before 1939: 8.0%
– Homes built since 2000: 11.8%
– Median year built: 1980
– Total homes: 12,057
You may also like: Cities with the fastest-growing home prices in Alabama

Prestinian // Wikimedia Commons
#5. Etowah County
– Homes built before 1939: 8.8%
– Homes built since 2000: 14.3%
– Median year built: 1973
– Total homes: 47,805

M Floyd // Flickr
#4. Jefferson County
– Homes built before 1939: 9.7%
– Homes built since 2000: 16.4%
– Median year built: 1974
– Total homes: 308,825

Rivers Langley; SaveRivers // Wikimedia Commons
#3. Chambers County
– Homes built before 1939: 11.2%
– Homes built since 2000: 18.8%
– Median year built: 1978
– Total homes: 16,985

JNix // Shutterstock
#2. Clay County
– Homes built before 1939: 11.7%
– Homes built since 2000: 16.8%
– Median year built: 1979
– Total homes: 6,832

DXR // Wikimedia Commons
#1. Dallas County
– Homes built before 1939: 12.1%
– Homes built since 2000: 11.8%
– Median year built: 1974
– Total homes: 20,427
You may also like: Best counties to retire to in Alabama