Counties with the lowest hospital bed capacity in Alabama
Published 2:01 pm Friday, February 25, 2022
Rudi Weikard // Wikimedia Commons
Counties with the lowest hospital bed capacity in Alabama
The vaccine deployment in December 2020 signaled a turning point in the COVID-19 pandemic. By the end of May 2021, 40% of the U.S. population was fully vaccinated. But as vaccination rates lagged over the summer, new surges of COVID-19 came, including Delta in the summer of 2021, and now the Omicron variant, which comprises the majority of cases in the U.S.
Researchers around the world have reported that Omicron is more transmissible than Delta, making breakthrough and repeat infections more likely. Early research suggests this strain may cause less severe illness than Delta and the original virus, however, health officials have warned an Omicron-driven surge could still increase hospitalization and death rates—especially in areas with less vaccinated populations.
The United States as of Feb. 24 reached 942,985 COVID-19-related deaths and nearly 78.7 million COVID-19 cases, according to Johns Hopkins University. Currently, 64.8% of the population is fully vaccinated, and 43.4% have received booster doses.
Stacker compiled a list of the counties with the lowest in-patient bed capacity in Alabama using data from the U.S. Department of Health & Human Services and vaccination data from Covid Act Now. Counties are ranked by the percent of in-patient hospital beds filled as of Feb. 23, with the percent of hospital beds filled by COVID-19 patients serving as a tiebreaker. Hospitalization data was available for about 77% of counties in the U.S. Keep reading to see what hospital capacity looks like in your county.
![]()

Rudi Weikard // Wikimedia Commons
#50. Cherokee County, AL
– Inpatient beds occupied: 33.0% (0.0% by COVID-19 patients)
— 51.5% more availability than Alabama overall
– ICU beds occupied: data not available
— 48% full in Alabama overall
– Cases per 100k in last 7 days: 157 (41 cases)
– Population that is fully vaccinated: 30.3% (7,929 fully vaccinated)
— -39.5% lower vaccination rate than Alabama

Canva
#49. Bullock County, AL
– Inpatient beds occupied: 33.0% (0.0% by COVID-19 patients)
— 51.5% more availability than Alabama overall
– ICU beds occupied: data not available
— 48% full in Alabama overall
– Cases per 100k in last 7 days: 79 (8 cases)
– Population that is fully vaccinated: not available

Canva
#48. Sumter County, AL
– Inpatient beds occupied: 33.0% (2.0% by COVID-19 patients)
— 51.5% more availability than Alabama overall
– ICU beds occupied: data not available
— 48% full in Alabama overall
– Cases per 100k in last 7 days: 1,038 (129 cases)
– Population that is fully vaccinated: 50.0% (6,212 fully vaccinated)
— -0.2% lower vaccination rate than Alabama

Canva
#47. Fayette County, AL
– Inpatient beds occupied: 35.0% (5.0% by COVID-19 patients)
— 48.5% more availability than Alabama overall
– ICU beds occupied: 0.0% (0.0% by COVID-19 patients)
— 100.0% more availability than Alabama overall
– Cases per 100k in last 7 days: 767 (125 cases)
– Population that is fully vaccinated: 34.5% (5,625 fully vaccinated)
— -31.1% lower vaccination rate than Alabama

JNix // Shutterstock
#46. Clay County, AL
– Inpatient beds occupied: 36.0% (4.0% by COVID-19 patients)
— 47.1% more availability than Alabama overall
– ICU beds occupied: 71.0% (25.0% by COVID-19 patients)
— 47.9% more full than Alabama overall
– Cases per 100k in last 7 days: 166 (22 cases)
– Population that is fully vaccinated: 41.2% (5,448 fully vaccinated)
— -17.8% lower vaccination rate than Alabama

Canva
#45. Greene County, AL
– Inpatient beds occupied: 37.0% (0.0% by COVID-19 patients)
— 45.6% more availability than Alabama overall
– ICU beds occupied: data not available
— 48% full in Alabama overall
– Cases per 100k in last 7 days: 567 (46 cases)
– Population that is fully vaccinated: 50.1% (4,060 fully vaccinated)
— 0.0% lower vaccination rate than Alabama

Carol M. Highsmith // Wikimedia Commons
#44. Hale County, AL
– Inpatient beds occupied: 37.0% (2.0% by COVID-19 patients)
— 45.6% more availability than Alabama overall
– ICU beds occupied: data not available
— 48% full in Alabama overall
– Cases per 100k in last 7 days: 539 (79 cases)
– Population that is fully vaccinated: 60.5% (8,867 fully vaccinated)
— 20.8% higher vaccination rate than Alabama

Chris Pruitt // Wikimedia Commons
#43. Butler County, AL
– Inpatient beds occupied: 39.0% (6.0% by COVID-19 patients)
— 42.6% more availability than Alabama overall
– ICU beds occupied: 65.0% (0.0% by COVID-19 patients)
— 35.4% more full than Alabama overall
– Cases per 100k in last 7 days: 129 (25 cases)
– Population that is fully vaccinated: 38.9% (7,565 fully vaccinated)
— -22.4% lower vaccination rate than Alabama

DXR // Wikimedia Commons
#42. Dallas County, AL
– Inpatient beds occupied: 39.0% (5.0% by COVID-19 patients)
— 42.6% more availability than Alabama overall
– ICU beds occupied: 71.0% (24.0% by COVID-19 patients)
— 47.9% more full than Alabama overall
– Cases per 100k in last 7 days: 196 (73 cases)
– Population that is fully vaccinated: 44.5% (16,546 fully vaccinated)
— -11.2% lower vaccination rate than Alabama

Canva
#41. Winston County, AL
– Inpatient beds occupied: 39.0% (6.0% by COVID-19 patients)
— 42.6% more availability than Alabama overall
– ICU beds occupied: data not available
— 48% full in Alabama overall
– Cases per 100k in last 7 days: 347 (82 cases)
– Population that is fully vaccinated: 21.7% (5,135 fully vaccinated)
— -56.7% lower vaccination rate than Alabama

Rudi Weikard // Wikimedia Commons
#40. Blount County, AL
– Inpatient beds occupied: 40.0% (7.0% by COVID-19 patients)
— 41.2% more availability than Alabama overall
– ICU beds occupied: 83.0% (2.0% by COVID-19 patients)
— 72.9% more full than Alabama overall
– Cases per 100k in last 7 days: 195 (113 cases)
– Population that is fully vaccinated: 31.2% (18,059 fully vaccinated)
— -37.7% lower vaccination rate than Alabama

Rivers A. Langley; SaveRivers // Wikimedia Commons
#39. Tallapoosa County, AL
– Inpatient beds occupied: 40.0% (14.0% by COVID-19 patients)
— 41.2% more availability than Alabama overall
– ICU beds occupied: 92.0% (79.0% by COVID-19 patients)
— 91.7% more full than Alabama overall
– Cases per 100k in last 7 days: 146 (59 cases)
– Population that is fully vaccinated: 38.1% (15,378 fully vaccinated)
— -24.0% lower vaccination rate than Alabama

Carol M. Highsmith // Wikimedia Commons
#38. Monroe County, AL
– Inpatient beds occupied: 41.0% (9.0% by COVID-19 patients)
— 39.7% more availability than Alabama overall
– ICU beds occupied: 55.0% (32.0% by COVID-19 patients)
— 14.6% more full than Alabama overall
– Cases per 100k in last 7 days: 130 (27 cases)
– Population that is fully vaccinated: 43.1% (8,935 fully vaccinated)
— -14.0% lower vaccination rate than Alabama

Rudi Weikard // Wikimedia Commons
#37. Franklin County, AL
– Inpatient beds occupied: 43.0% (9.0% by COVID-19 patients)
— 36.8% more availability than Alabama overall
– ICU beds occupied: 52.0% (26.0% by COVID-19 patients)
— 8.3% more full than Alabama overall
– Cases per 100k in last 7 days: 201 (63 cases)
– Population that is fully vaccinated: 43.1% (13,512 fully vaccinated)
— -14.0% lower vaccination rate than Alabama

Rudi Weikard // Wikimedia Commons
#36. Marion County, AL
– Inpatient beds occupied: 45.0% (4.0% by COVID-19 patients)
— 33.8% more availability than Alabama overall
– ICU beds occupied: 39.0% (0.0% by COVID-19 patients)
— 18.8% more availability than Alabama overall
– Cases per 100k in last 7 days: 222 (66 cases)
– Population that is fully vaccinated: 35.9% (10,674 fully vaccinated)
— -28.3% lower vaccination rate than Alabama

Chris Pruitt // Wikimedia Commons
#35. Conecuh County, AL
– Inpatient beds occupied: 45.0% (11.0% by COVID-19 patients)
— 33.8% more availability than Alabama overall
– ICU beds occupied: data not available
— 48% full in Alabama overall
– Cases per 100k in last 7 days: 91 (11 cases)
– Population that is fully vaccinated: not available

Kreeder13 // Wikimedia Commons
#34. Pike County, AL
– Inpatient beds occupied: 50.0% (7.0% by COVID-19 patients)
— 26.5% more availability than Alabama overall
– ICU beds occupied: 39.0% (17.0% by COVID-19 patients)
— 18.8% more availability than Alabama overall
– Cases per 100k in last 7 days: 112 (37 cases)
– Population that is fully vaccinated: 41.4% (13,716 fully vaccinated)
— -17.4% lower vaccination rate than Alabama

Canva
#33. Bibb County, AL
– Inpatient beds occupied: 50.0% (18.0% by COVID-19 patients)
— 26.5% more availability than Alabama overall
– ICU beds occupied: data not available
— 48% full in Alabama overall
– Cases per 100k in last 7 days: 129 (29 cases)
– Population that is fully vaccinated: 34.2% (7,665 fully vaccinated)
— -31.7% lower vaccination rate than Alabama

Springfieldohio // Wikimedia Commons
#32. Jackson County, AL
– Inpatient beds occupied: 53.0% (13.0% by COVID-19 patients)
— 22.1% more availability than Alabama overall
– ICU beds occupied: 86.0% (33.0% by COVID-19 patients)
— 79.2% more full than Alabama overall
– Cases per 100k in last 7 days: 176 (91 cases)
– Population that is fully vaccinated: 48.6% (25,067 fully vaccinated)
— -3.0% lower vaccination rate than Alabama

Rivers Langley SaveRivers // Wikimedia Commons
#31. Russell County, AL
– Inpatient beds occupied: 55.0% (2.0% by COVID-19 patients)
— 19.1% more availability than Alabama overall
– ICU beds occupied: 64.0% (2.0% by COVID-19 patients)
— 33.3% more full than Alabama overall
– Cases per 100k in last 7 days: 78 (45 cases)
– Population that is fully vaccinated: 40.1% (23,271 fully vaccinated)
— -20.0% lower vaccination rate than Alabama

Wmr36104 // Wikimedia Commons
#30. Geneva County, AL
– Inpatient beds occupied: 58.0% (9.0% by COVID-19 patients)
— 14.7% more availability than Alabama overall
– ICU beds occupied: 55.0% (24.0% by COVID-19 patients)
— 14.6% more full than Alabama overall
– Cases per 100k in last 7 days: 137 (36 cases)
– Population that is fully vaccinated: 39.9% (10,471 fully vaccinated)
— -20.4% lower vaccination rate than Alabama

Canva
#29. Walker County, AL
– Inpatient beds occupied: 59.0% (8.0% by COVID-19 patients)
— 13.2% more availability than Alabama overall
– ICU beds occupied: 99.0% (38.0% by COVID-19 patients)
— 106.3% more full than Alabama overall
– Cases per 100k in last 7 days: 220 (140 cases)
– Population that is fully vaccinated: 46.6% (29,609 fully vaccinated)
— -7.0% lower vaccination rate than Alabama

Canva
#28. DeKalb County, AL
– Inpatient beds occupied: 61.0% (12.0% by COVID-19 patients)
— 10.3% more availability than Alabama overall
– ICU beds occupied: 60.0% (11.0% by COVID-19 patients)
— 25.0% more full than Alabama overall
– Cases per 100k in last 7 days: 154 (110 cases)
– Population that is fully vaccinated: 33.3% (23,788 fully vaccinated)
— -33.5% lower vaccination rate than Alabama

Chris Pruitt // Wikimedia Commons
#27. Covington County, AL
– Inpatient beds occupied: 61.0% (9.0% by COVID-19 patients)
— 10.3% more availability than Alabama overall
– ICU beds occupied: 80.0% (22.0% by COVID-19 patients)
— 66.7% more full than Alabama overall
– Cases per 100k in last 7 days: 184 (68 cases)
– Population that is fully vaccinated: 37.7% (13,963 fully vaccinated)
— -24.8% lower vaccination rate than Alabama

Michael Rivera // Wikimedia Commons
#26. Dale County, AL
– Inpatient beds occupied: 61.0% (10.0% by COVID-19 patients)
— 10.3% more availability than Alabama overall
– ICU beds occupied: 84.0% (60.0% by COVID-19 patients)
— 75.0% more full than Alabama overall
– Cases per 100k in last 7 days: 118 (58 cases)
– Population that is fully vaccinated: 47.1% (23,157 fully vaccinated)
— -6.0% lower vaccination rate than Alabama

Rivers Langley; SaveRivers // Wikimedia Commons
#25. Crenshaw County, AL
– Inpatient beds occupied: 61.0% (8.0% by COVID-19 patients)
— 10.3% more availability than Alabama overall
– ICU beds occupied: data not available
— 48% full in Alabama overall
– Cases per 100k in last 7 days: 109 (15 cases)
– Population that is fully vaccinated: not available

Rivers Langley; SaveRivers // Wikimedia Commons
#24. Barbour County, AL
– Inpatient beds occupied: 62.0% (4.0% by COVID-19 patients)
— 8.8% more availability than Alabama overall
– ICU beds occupied: 69.0% (40.0% by COVID-19 patients)
— 43.8% more full than Alabama overall
– Cases per 100k in last 7 days: 69 (17 cases)
– Population that is fully vaccinated: not available

Dailynetworks // Wikimedia Commons
#23. Colbert County, AL
– Inpatient beds occupied: 62.0% (9.0% by COVID-19 patients)
— 8.8% more availability than Alabama overall
– ICU beds occupied: 80.0% (45.0% by COVID-19 patients)
— 66.7% more full than Alabama overall
– Cases per 100k in last 7 days: 183 (101 cases)
– Population that is fully vaccinated: 47.5% (26,238 fully vaccinated)
— -5.2% lower vaccination rate than Alabama

Carol M. Highsmith // Wikimedia Commons
#22. Limestone County, AL
– Inpatient beds occupied: 63.0% (14.0% by COVID-19 patients)
— 7.4% more availability than Alabama overall
– ICU beds occupied: 76.0% (63.0% by COVID-19 patients)
— 58.3% more full than Alabama overall
– Cases per 100k in last 7 days: 184 (182 cases)
– Population that is fully vaccinated: 38.5% (38,090 fully vaccinated)
— -23.2% lower vaccination rate than Alabama

Rivers Langley; SaveRivers // Wikimedia Commons
#21. Talladega County, AL
– Inpatient beds occupied: 65.0% (9.0% by COVID-19 patients)
— 4.4% more availability than Alabama overall
– ICU beds occupied: 89.0% (28.0% by COVID-19 patients)
— 85.4% more full than Alabama overall
– Cases per 100k in last 7 days: 199 (159 cases)
– Population that is fully vaccinated: 36.1% (28,892 fully vaccinated)
— -27.9% lower vaccination rate than Alabama

Tracy Burroughs Brown // Shutterstock
#20. Tuscaloosa County, AL
– Inpatient beds occupied: 66.0% (8.0% by COVID-19 patients)
— 2.9% more availability than Alabama overall
– ICU beds occupied: 91.0% (15.0% by COVID-19 patients)
— 89.6% more full than Alabama overall
– Cases per 100k in last 7 days: 321 (672 cases)
– Population that is fully vaccinated: 43.0% (90,007 fully vaccinated)
— -14.2% lower vaccination rate than Alabama

Canva
#19. Marengo County, AL
– Inpatient beds occupied: 67.0% (13.0% by COVID-19 patients)
— 1.5% more availability than Alabama overall
– ICU beds occupied: 96.0% (38.0% by COVID-19 patients)
— 100.0% more full than Alabama overall
– Cases per 100k in last 7 days: 1,490 (281 cases)
– Population that is fully vaccinated: 53.8% (10,157 fully vaccinated)
— 7.4% higher vaccination rate than Alabama

Canva
#18. Marshall County, AL
– Inpatient beds occupied: 70.0% (15.0% by COVID-19 patients)
— 2.9% more full than Alabama overall
– ICU beds occupied: 84.0% (24.0% by COVID-19 patients)
— 75.0% more full than Alabama overall
– Cases per 100k in last 7 days: 103 (100 cases)
– Population that is fully vaccinated: 45.0% (43,563 fully vaccinated)
— -10.2% lower vaccination rate than Alabama

Calvin Beale // Wikimedia Commons
#17. Coffee County, AL
– Inpatient beds occupied: 71.0% (16.0% by COVID-19 patients)
— 4.4% more full than Alabama overall
– ICU beds occupied: 51.0% (27.0% by COVID-19 patients)
— 6.3% more full than Alabama overall
– Cases per 100k in last 7 days: 96 (50 cases)
– Population that is fully vaccinated: 46.6% (24,370 fully vaccinated)
— -7.0% lower vaccination rate than Alabama

Chris Pruitt // Wikimedia Commons
#16. Autauga County, AL
– Inpatient beds occupied: 71.0% (11.0% by COVID-19 patients)
— 4.4% more full than Alabama overall
– ICU beds occupied: 97.0% (37.0% by COVID-19 patients)
— 102.1% more full than Alabama overall
– Cases per 100k in last 7 days: 165 (92 cases)
– Population that is fully vaccinated: 43.3% (24,173 fully vaccinated)
— -13.6% lower vaccination rate than Alabama

MPearsallArt // Wikimedia Commons
#15. Morgan County, AL
– Inpatient beds occupied: 71.0% (8.0% by COVID-19 patients)
— 4.4% more full than Alabama overall
– ICU beds occupied: 102.0% (21.0% by COVID-19 patients)
— 112.5% more full than Alabama overall
– Cases per 100k in last 7 days: 160 (191 cases)
– Population that is fully vaccinated: 43.1% (51,592 fully vaccinated)
— -14.0% lower vaccination rate than Alabama

Rivers Langley; SaveRivers // Wikimedia Commons
#14. Shelby County, AL
– Inpatient beds occupied: 74.0% (15.0% by COVID-19 patients)
— 8.8% more full than Alabama overall
– ICU beds occupied: 85.0% (29.0% by COVID-19 patients)
— 77.1% more full than Alabama overall
– Cases per 100k in last 7 days: 158 (345 cases)
– Population that is fully vaccinated: 35.7% (77,765 fully vaccinated)
— -28.7% lower vaccination rate than Alabama

Chris Pruitt // wikicommons
#13. Montgomery County, AL
– Inpatient beds occupied: 74.0% (9.0% by COVID-19 patients)
— 8.8% more full than Alabama overall
– ICU beds occupied: 95.0% (23.0% by COVID-19 patients)
— 97.9% more full than Alabama overall
– Cases per 100k in last 7 days: 104 (235 cases)
– Population that is fully vaccinated: 51.1% (115,700 fully vaccinated)
— 2.0% higher vaccination rate than Alabama

Chris Pruitt // Wikimedia Commons
#12. Cullman County, AL
– Inpatient beds occupied: 75.0% (25.0% by COVID-19 patients)
— 10.3% more full than Alabama overall
– ICU beds occupied: 69.0% (39.0% by COVID-19 patients)
— 43.8% more full than Alabama overall
– Cases per 100k in last 7 days: 171 (143 cases)
– Population that is fully vaccinated: 37.8% (31,671 fully vaccinated)
— -24.6% lower vaccination rate than Alabama

Prestinian // Wikimedia Commons
#11. Etowah County, AL
– Inpatient beds occupied: 77.0% (14.0% by COVID-19 patients)
— 13.2% more full than Alabama overall
– ICU beds occupied: 98.0% (40.0% by COVID-19 patients)
— 104.2% more full than Alabama overall
– Cases per 100k in last 7 days: 198 (202 cases)
– Population that is fully vaccinated: 40.5% (41,409 fully vaccinated)
— -19.2% lower vaccination rate than Alabama

Jodybwiki // Wikimedia Commons
#10. Baldwin County, AL
– Inpatient beds occupied: 79.0% (9.0% by COVID-19 patients)
— 16.2% more full than Alabama overall
– ICU beds occupied: 99.0% (32.0% by COVID-19 patients)
— 106.3% more full than Alabama overall
– Cases per 100k in last 7 days: 116 (260 cases)
– Population that is fully vaccinated: 50.0% (111,655 fully vaccinated)
— -0.2% lower vaccination rate than Alabama

Rivers Langley; SaveRivers // Wikimedia Commons
#9. Chambers County, AL
– Inpatient beds occupied: 81.0% (13.0% by COVID-19 patients)
— 19.1% more full than Alabama overall
– ICU beds occupied: data not available
— 48% full in Alabama overall
– Cases per 100k in last 7 days: 99 (33 cases)
– Population that is fully vaccinated: 30.8% (10,254 fully vaccinated)
— -38.5% lower vaccination rate than Alabama

Wayne James // Shutterstock
#8. Lauderdale County, AL
– Inpatient beds occupied: 83.0% (8.0% by COVID-19 patients)
— 22.1% more full than Alabama overall
– ICU beds occupied: 77.0% (14.0% by COVID-19 patients)
— 60.4% more full than Alabama overall
– Cases per 100k in last 7 days: 173 (160 cases)
– Population that is fully vaccinated: 46.0% (42,627 fully vaccinated)
— -8.2% lower vaccination rate than Alabama

Rivers Langley; SaveRivers // Wikimedia Commons
#7. Calhoun County, AL
– Inpatient beds occupied: 84.0% (6.0% by COVID-19 patients)
— 23.5% more full than Alabama overall
– ICU beds occupied: 98.0% (17.0% by COVID-19 patients)
— 104.2% more full than Alabama overall
– Cases per 100k in last 7 days: 174 (198 cases)
– Population that is fully vaccinated: 46.2% (52,478 fully vaccinated)
— -7.8% lower vaccination rate than Alabama

M Floyd // Flickr
#6. Jefferson County, AL
– Inpatient beds occupied: 85.0% (8.0% by COVID-19 patients)
— 25.0% more full than Alabama overall
– ICU beds occupied: 93.0% (16.0% by COVID-19 patients)
— 93.8% more full than Alabama overall
– Cases per 100k in last 7 days: 109 (717 cases)
– Population that is fully vaccinated: 57.0% (375,536 fully vaccinated)
— 13.8% higher vaccination rate than Alabama

Altairisfar // Wikicommons
#5. Mobile County, AL
– Inpatient beds occupied: 86.0% (9.0% by COVID-19 patients)
— 26.5% more full than Alabama overall
– ICU beds occupied: 85.0% (19.0% by COVID-19 patients)
— 77.1% more full than Alabama overall
– Cases per 100k in last 7 days: 162 (671 cases)
– Population that is fully vaccinated: 48.9% (201,889 fully vaccinated)
— -2.4% lower vaccination rate than Alabama

Pixabay
#4. Madison County, AL
– Inpatient beds occupied: 87.0% (13.0% by COVID-19 patients)
— 27.9% more full than Alabama overall
– ICU beds occupied: 94.0% (33.0% by COVID-19 patients)
— 95.8% more full than Alabama overall
– Cases per 100k in last 7 days: 177 (661 cases)
– Population that is fully vaccinated: 60.9% (227,012 fully vaccinated)
— 21.6% higher vaccination rate than Alabama

Carol M. Highsmith/Library of Congress // Wikimedia Commons
#3. Houston County, AL
– Inpatient beds occupied: 88.0% (13.0% by COVID-19 patients)
— 29.4% more full than Alabama overall
– ICU beds occupied: 103.0% (33.0% by COVID-19 patients)
— 114.6% more full than Alabama overall
– Cases per 100k in last 7 days: 150 (159 cases)
– Population that is fully vaccinated: 42.6% (45,099 fully vaccinated)
— -15.0% lower vaccination rate than Alabama

Library of Congress
#2. Lee County, AL
– Inpatient beds occupied: 89.0% (13.0% by COVID-19 patients)
— 30.9% more full than Alabama overall
– ICU beds occupied: 88.0% (35.0% by COVID-19 patients)
— 83.3% more full than Alabama overall
– Cases per 100k in last 7 days: 82 (135 cases)
– Population that is fully vaccinated: 39.5% (65,019 fully vaccinated)
— -21.2% lower vaccination rate than Alabama

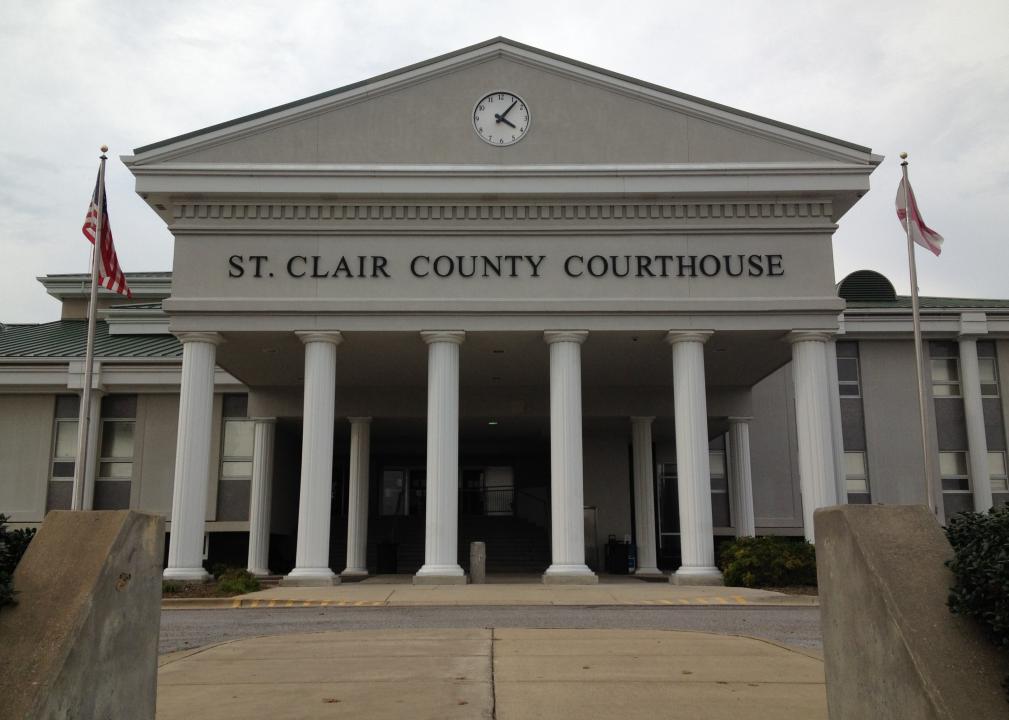
Rudi Weikard // Wikimedia Commons
#1. St. Clair County, AL
– Inpatient beds occupied: 97.0% (20.0% by COVID-19 patients)
— 42.6% more full than Alabama overall
– ICU beds occupied: 93.0% (5.0% by COVID-19 patients)
— 93.8% more full than Alabama overall
– Cases per 100k in last 7 days: 130 (116 cases)
– Population that is fully vaccinated: 38.6% (34,550 fully vaccinated)
— -23.0% lower vaccination rate than Alabama