Counties with the lowest hospital bed capacity in Alabama
Published 2:04 pm Friday, January 28, 2022
Rudi Weikard // Wikimedia Commons
Counties with the lowest hospital bed capacity in Alabama
The vaccine deployment in December 2020 signaled a turning point in the COVID-19 pandemic. By the end of May 2021, 40% of the U.S. population was fully vaccinated. But as vaccination rates lagged over the summer, new surges of COVID-19 came, including Delta in the summer of 2021, and now the Omicron variant, which comprises the majority of cases in the U.S.
Researchers around the world have reported that Omicron is more transmissible than Delta, making breakthrough and repeat infections more likely. Early research suggests this strain may cause less severe illness than Delta and the original virus, however, health officials have warned an Omicron-driven surge could still increase hospitalization and death rates—especially in areas with less vaccinated populations.
The United States as of Jan. 27 reached 877,691 COVID-19-related deaths and 73.2 million COVID-19 cases, according to Johns Hopkins University. Currently, 63.6% of the population is fully vaccinated, and 41% have received booster doses.
Stacker compiled a list of the counties with the lowest in-patient bed capacity in Alabama using data from the U.S. Department of Health & Human Services and vaccination data from Covid Act Now. Counties are ranked by the percent of in-patient hospital beds filled as of Jan. 26, with the percent of hospital beds filled by COVID-19 patients serving as a tiebreaker. Hospitalization data was available for about 77% of counties in the U.S. Keep reading to see what hospital capacity looks like in your county.
![]()

Canva
#50. Chilton County, AL
– Inpatient beds occupied: 37.0% (13.0% by COVID-19 patients)
— 53.2% more availability than Alabama overall
– ICU beds occupied: 21.0% (21.0% by COVID-19 patients)
— 77.2% more availability than Alabama overall
– Cases per 100k in last 7 days: 1,612 (716 cases)
– Population that is fully vaccinated: 35.2% (15,653 fully vaccinated)
— -28.6% lower vaccination rate than Alabama

Canva
#49. Winston County, AL
– Inpatient beds occupied: 39.0% (11.0% by COVID-19 patients)
— 50.6% more availability than Alabama overall
– ICU beds occupied: data not available
— 92% full in Alabama overall
– Cases per 100k in last 7 days: 3,521 (832 cases)
– Population that is fully vaccinated: 21.5% (5,072 fully vaccinated)
— -56.4% lower vaccination rate than Alabama

Wmr36104 // Wikimedia Commons
#48. Geneva County, AL
– Inpatient beds occupied: 41.0% (9.0% by COVID-19 patients)
— 48.1% more availability than Alabama overall
– ICU beds occupied: 50.0% (0.0% by COVID-19 patients)
— 45.7% more availability than Alabama overall
– Cases per 100k in last 7 days: 1,671 (439 cases)
– Population that is fully vaccinated: 39.3% (10,317 fully vaccinated)
— -20.3% lower vaccination rate than Alabama

Canva
#47. Sumter County, AL
– Inpatient beds occupied: 41.0% (2.0% by COVID-19 patients)
— 48.1% more availability than Alabama overall
– ICU beds occupied: data not available
— 92% full in Alabama overall
– Cases per 100k in last 7 days: 2,599 (323 cases)
– Population that is fully vaccinated: 49.0% (6,090 fully vaccinated)
— -0.6% lower vaccination rate than Alabama

Rivers A. Langley; SaveRivers // Wikimedia Commons
#46. Tallapoosa County, AL
– Inpatient beds occupied: 44.0% (21.0% by COVID-19 patients)
— 44.3% more availability than Alabama overall
– ICU beds occupied: 118.0% (95.0% by COVID-19 patients)
— 28.3% more full than Alabama overall
– Cases per 100k in last 7 days: 2,269 (916 cases)
– Population that is fully vaccinated: 37.6% (15,175 fully vaccinated)
— -23.7% lower vaccination rate than Alabama

Kreeder13 // Wikimedia Commons
#45. Pike County, AL
– Inpatient beds occupied: 45.0% (4.0% by COVID-19 patients)
— 43.0% more availability than Alabama overall
– ICU beds occupied: 54.0% (6.0% by COVID-19 patients)
— 41.3% more availability than Alabama overall
– Cases per 100k in last 7 days: 1,510 (500 cases)
– Population that is fully vaccinated: 40.5% (13,423 fully vaccinated)
— -17.8% lower vaccination rate than Alabama

Altairisfar // Wikimedia Commons
#44. Clarke County, AL
– Inpatient beds occupied: 45.0% (19.0% by COVID-19 patients)
— 43.0% more availability than Alabama overall
– ICU beds occupied: data not available
— 92% full in Alabama overall
– Cases per 100k in last 7 days: 2,261 (534 cases)
– Population that is fully vaccinated: 49.7% (11,746 fully vaccinated)
— 0.8% higher vaccination rate than Alabama

Rivers A. Langley; SaveRivers // Wikimedia Commons
#43. Randolph County, AL
– Inpatient beds occupied: 46.0% (5.0% by COVID-19 patients)
— 41.8% more availability than Alabama overall
– ICU beds occupied: data not available
— 92% full in Alabama overall
– Cases per 100k in last 7 days: 1,417 (322 cases)
– Population that is fully vaccinated: 31.8% (7,236 fully vaccinated)
— -35.5% lower vaccination rate than Alabama

DXR // Wikimedia Commons
#42. Dallas County, AL
– Inpatient beds occupied: 48.0% (12.0% by COVID-19 patients)
— 39.2% more availability than Alabama overall
– ICU beds occupied: 67.0% (20.0% by COVID-19 patients)
— 27.2% more availability than Alabama overall
– Cases per 100k in last 7 days: 1,691 (629 cases)
– Population that is fully vaccinated: 43.6% (16,207 fully vaccinated)
— -11.6% lower vaccination rate than Alabama

Rudi Weikard // Wikimedia Commons
#41. Marion County, AL
– Inpatient beds occupied: 48.0% (15.0% by COVID-19 patients)
— 39.2% more availability than Alabama overall
– ICU beds occupied: 82.0% (68.0% by COVID-19 patients)
— 10.9% more availability than Alabama overall
– Cases per 100k in last 7 days: 2,565 (762 cases)
– Population that is fully vaccinated: 35.5% (10,541 fully vaccinated)
— -28.0% lower vaccination rate than Alabama

Carol M. Highsmith // Wikimedia Commons
#40. Hale County, AL
– Inpatient beds occupied: 48.0% (27.0% by COVID-19 patients)
— 39.2% more availability than Alabama overall
– ICU beds occupied: data not available
— 92% full in Alabama overall
– Cases per 100k in last 7 days: 2,068 (303 cases)
– Population that is fully vaccinated: 59.5% (8,711 fully vaccinated)
— 20.7% higher vaccination rate than Alabama

Canva
#39. Escambia County, AL
– Inpatient beds occupied: 51.0% (18.0% by COVID-19 patients)
— 35.4% more availability than Alabama overall
– ICU beds occupied: 66.0% (50.0% by COVID-19 patients)
— 28.3% more availability than Alabama overall
– Cases per 100k in last 7 days: 1,531 (561 cases)
– Population that is fully vaccinated: 35.3% (12,926 fully vaccinated)
— -28.4% lower vaccination rate than Alabama

JNix // Shutterstock
#38. Clay County, AL
– Inpatient beds occupied: 51.0% (10.0% by COVID-19 patients)
— 35.4% more availability than Alabama overall
– ICU beds occupied: 132.0% (89.0% by COVID-19 patients)
— 43.5% more full than Alabama overall
– Cases per 100k in last 7 days: 2,947 (390 cases)
– Population that is fully vaccinated: 40.8% (5,394 fully vaccinated)
— -17.2% lower vaccination rate than Alabama

Springfieldohio // Wikimedia Commons
#37. Jackson County, AL
– Inpatient beds occupied: 52.0% (14.0% by COVID-19 patients)
— 34.2% more availability than Alabama overall
– ICU beds occupied: 77.0% (37.0% by COVID-19 patients)
— 16.3% more availability than Alabama overall
– Cases per 100k in last 7 days: 2,433 (1,256 cases)
– Population that is fully vaccinated: 47.6% (24,577 fully vaccinated)
— -3.4% lower vaccination rate than Alabama

Chris Pruitt // Wikimedia Commons
#36. Butler County, AL
– Inpatient beds occupied: 55.0% (17.0% by COVID-19 patients)
— 30.4% more availability than Alabama overall
– ICU beds occupied: 78.0% (0.0% by COVID-19 patients)
— 15.2% more availability than Alabama overall
– Cases per 100k in last 7 days: 1,352 (263 cases)
– Population that is fully vaccinated: 38.2% (7,426 fully vaccinated)
— -22.5% lower vaccination rate than Alabama

Carol M. Highsmith // Wikimedia Commons
#35. Monroe County, AL
– Inpatient beds occupied: 58.0% (20.0% by COVID-19 patients)
— 26.6% more availability than Alabama overall
– ICU beds occupied: 80.0% (55.0% by COVID-19 patients)
— 13.0% more availability than Alabama overall
– Cases per 100k in last 7 days: 2,214 (459 cases)
– Population that is fully vaccinated: 42.4% (8,797 fully vaccinated)
— -14.0% lower vaccination rate than Alabama

Canva
#34. Bibb County, AL
– Inpatient beds occupied: 58.0% (12.0% by COVID-19 patients)
— 26.6% more availability than Alabama overall
– ICU beds occupied: data not available
— 92% full in Alabama overall
– Cases per 100k in last 7 days: 1,974 (442 cases)
– Population that is fully vaccinated: 33.7% (7,538 fully vaccinated)
— -31.6% lower vaccination rate than Alabama

Canva
#33. Walker County, AL
– Inpatient beds occupied: 63.0% (20.0% by COVID-19 patients)
— 20.3% more availability than Alabama overall
– ICU beds occupied: 99.0% (39.0% by COVID-19 patients)
— 7.6% more full than Alabama overall
– Cases per 100k in last 7 days: 2,909 (1,848 cases)
– Population that is fully vaccinated: 46.0% (29,205 fully vaccinated)
— -6.7% lower vaccination rate than Alabama

Rivers Langley; SaveRivers // Wikimedia Commons
#32. Barbour County, AL
– Inpatient beds occupied: 65.0% (23.0% by COVID-19 patients)
— 17.7% more availability than Alabama overall
– ICU beds occupied: 91.0% (0.0% by COVID-19 patients)
— 1.1% more availability than Alabama overall
– Cases per 100k in last 7 days: 1,268 (313 cases)
– Population that is fully vaccinated: 43.5% (10,736 fully vaccinated)
— -11.8% lower vaccination rate than Alabama

Tracy Burroughs Brown // Shutterstock
#31. Tuscaloosa County, AL
– Inpatient beds occupied: 65.0% (19.0% by COVID-19 patients)
— 17.7% more availability than Alabama overall
– ICU beds occupied: 94.0% (29.0% by COVID-19 patients)
— 2.2% more full than Alabama overall
– Cases per 100k in last 7 days: 2,147 (4,494 cases)
– Population that is fully vaccinated: 42.3% (88,659 fully vaccinated)
— -14.2% lower vaccination rate than Alabama

Canva
#30. Marshall County, AL
– Inpatient beds occupied: 67.0% (17.0% by COVID-19 patients)
— 15.2% more availability than Alabama overall
– ICU beds occupied: 74.0% (29.0% by COVID-19 patients)
— 19.6% more availability than Alabama overall
– Cases per 100k in last 7 days: 2,213 (2,142 cases)
– Population that is fully vaccinated: 44.3% (42,851 fully vaccinated)
— -10.1% lower vaccination rate than Alabama

Rivers Langley; SaveRivers // Wikimedia Commons
#29. Crenshaw County, AL
– Inpatient beds occupied: 68.0% (17.0% by COVID-19 patients)
— 13.9% more availability than Alabama overall
– ICU beds occupied: data not available
— 92% full in Alabama overall
– Cases per 100k in last 7 days: 1,663 (229 cases)
– Population that is fully vaccinated: 33.5% (4,614 fully vaccinated)
— -32.0% lower vaccination rate than Alabama

Chris Pruitt // Wikimedia Commons
#28. Conecuh County, AL
– Inpatient beds occupied: 68.0% (47.0% by COVID-19 patients)
— 13.9% more availability than Alabama overall
– ICU beds occupied: data not available
— 92% full in Alabama overall
– Cases per 100k in last 7 days: 1,715 (207 cases)
– Population that is fully vaccinated: 42.3% (5,108 fully vaccinated)
— -14.2% lower vaccination rate than Alabama

Canva
#27. DeKalb County, AL
– Inpatient beds occupied: 69.0% (16.0% by COVID-19 patients)
— 12.7% more availability than Alabama overall
– ICU beds occupied: 95.0% (37.0% by COVID-19 patients)
— 3.3% more full than Alabama overall
– Cases per 100k in last 7 days: 2,091 (1,495 cases)
– Population that is fully vaccinated: 32.8% (23,429 fully vaccinated)
— -33.5% lower vaccination rate than Alabama

Rudi Weikard // Wikimedia Commons
#26. Franklin County, AL
– Inpatient beds occupied: 70.0% (23.0% by COVID-19 patients)
— 11.4% more availability than Alabama overall
– ICU beds occupied: 71.0% (12.0% by COVID-19 patients)
— 22.8% more availability than Alabama overall
– Cases per 100k in last 7 days: 3,342 (1,048 cases)
– Population that is fully vaccinated: 42.4% (13,303 fully vaccinated)
— -14.0% lower vaccination rate than Alabama

Rivers Langley; SaveRivers // Wikimedia Commons
#25. Talladega County, AL
– Inpatient beds occupied: 71.0% (17.0% by COVID-19 patients)
— 10.1% more availability than Alabama overall
– ICU beds occupied: 81.0% (44.0% by COVID-19 patients)
— 12.0% more availability than Alabama overall
– Cases per 100k in last 7 days: 2,039 (1,631 cases)
– Population that is fully vaccinated: 35.6% (28,479 fully vaccinated)
— -27.8% lower vaccination rate than Alabama

MPearsallArt // Wikimedia Commons
#24. Morgan County, AL
– Inpatient beds occupied: 71.0% (25.0% by COVID-19 patients)
— 10.1% more availability than Alabama overall
– ICU beds occupied: 82.0% (53.0% by COVID-19 patients)
— 10.9% more availability than Alabama overall
– Cases per 100k in last 7 days: 2,610 (3,124 cases)
– Population that is fully vaccinated: 42.5% (50,813 fully vaccinated)
— -13.8% lower vaccination rate than Alabama

Dailynetworks // Wikimedia Commons
#23. Colbert County, AL
– Inpatient beds occupied: 71.0% (19.0% by COVID-19 patients)
— 10.1% more availability than Alabama overall
– ICU beds occupied: 100.0% (94.0% by COVID-19 patients)
— 8.7% more full than Alabama overall
– Cases per 100k in last 7 days: 3,637 (2,009 cases)
– Population that is fully vaccinated: 46.7% (25,822 fully vaccinated)
— -5.3% lower vaccination rate than Alabama

Rivers Langley; SaveRivers // Wikimedia Commons
#22. Shelby County, AL
– Inpatient beds occupied: 72.0% (20.0% by COVID-19 patients)
— 8.9% more availability than Alabama overall
– ICU beds occupied: 75.0% (24.0% by COVID-19 patients)
— 18.5% more availability than Alabama overall
– Cases per 100k in last 7 days: 1,984 (4,319 cases)
– Population that is fully vaccinated: 35.2% (76,555 fully vaccinated)
— -28.6% lower vaccination rate than Alabama

Michael Rivera // Wikimedia Commons
#21. Dale County, AL
– Inpatient beds occupied: 72.0% (24.0% by COVID-19 patients)
— 8.9% more availability than Alabama overall
– ICU beds occupied: 89.0% (69.0% by COVID-19 patients)
— 3.3% more availability than Alabama overall
– Cases per 100k in last 7 days: 1,371 (674 cases)
– Population that is fully vaccinated: 46.2% (22,695 fully vaccinated)
— -6.3% lower vaccination rate than Alabama

Carol M. Highsmith // Wikimedia Commons
#20. Limestone County, AL
– Inpatient beds occupied: 73.0% (18.0% by COVID-19 patients)
— 7.6% more availability than Alabama overall
– ICU beds occupied: 89.0% (30.0% by COVID-19 patients)
— 3.3% more availability than Alabama overall
– Cases per 100k in last 7 days: 1,903 (1,882 cases)
– Population that is fully vaccinated: 37.8% (37,394 fully vaccinated)
— -23.3% lower vaccination rate than Alabama

Rivers Langley SaveRivers // Wikimedia Commons
#19. Russell County, AL
– Inpatient beds occupied: 75.0% (7.0% by COVID-19 patients)
— 5.1% more availability than Alabama overall
– ICU beds occupied: 98.0% (32.0% by COVID-19 patients)
— 6.5% more full than Alabama overall
– Cases per 100k in last 7 days: 871 (505 cases)
– Population that is fully vaccinated: 38.8% (22,500 fully vaccinated)
— -21.3% lower vaccination rate than Alabama

Prestinian // Wikimedia Commons
#18. Etowah County, AL
– Inpatient beds occupied: 75.0% (25.0% by COVID-19 patients)
— 5.1% more availability than Alabama overall
– ICU beds occupied: 99.0% (28.0% by COVID-19 patients)
— 7.6% more full than Alabama overall
– Cases per 100k in last 7 days: 2,083 (2,130 cases)
– Population that is fully vaccinated: 40.0% (40,897 fully vaccinated)
— -18.9% lower vaccination rate than Alabama

Chris Pruitt // wikicommons
#17. Montgomery County, AL
– Inpatient beds occupied: 78.0% (24.0% by COVID-19 patients)
— 1.3% more availability than Alabama overall
– ICU beds occupied: 98.0% (38.0% by COVID-19 patients)
— 6.5% more full than Alabama overall
– Cases per 100k in last 7 days: 951 (2,153 cases)
– Population that is fully vaccinated: 50.0% (113,296 fully vaccinated)
— 1.4% higher vaccination rate than Alabama

Chris Pruitt // Wikimedia Commons
#16. Covington County, AL
– Inpatient beds occupied: 79.0% (17.0% by COVID-19 patients)
— 0.0% more availability than Alabama overall
– ICU beds occupied: 99.0% (33.0% by COVID-19 patients)
— 7.6% more full than Alabama overall
– Cases per 100k in last 7 days: 209,247 (77,524 cases)
– Population that is fully vaccinated: 37.1% (13,752 fully vaccinated)
— -24.7% lower vaccination rate than Alabama

Canva
#15. Marengo County, AL
– Inpatient beds occupied: 79.0% (29.0% by COVID-19 patients)
— 0.0% more availability than Alabama overall
– ICU beds occupied: 140.0% (100.0% by COVID-19 patients)
— 52.2% more full than Alabama overall
– Cases per 100k in last 7 days: 1,628 (307 cases)
– Population that is fully vaccinated: 52.8% (9,959 fully vaccinated)
— 7.1% higher vaccination rate than Alabama

Chris Pruitt // Wikimedia Commons
#14. Autauga County, AL
– Inpatient beds occupied: 79.0% (36.0% by COVID-19 patients)
— 0.0% more availability than Alabama overall
– ICU beds occupied: data not available
— 92% full in Alabama overall
– Cases per 100k in last 7 days: 1,042 (582 cases)
– Population that is fully vaccinated: 42.3% (23,655 fully vaccinated)
— -14.2% lower vaccination rate than Alabama

M Floyd // Flickr
#13. Jefferson County, AL
– Inpatient beds occupied: 84.0% (17.0% by COVID-19 patients)
— 6.3% more full than Alabama overall
– ICU beds occupied: 94.0% (29.0% by COVID-19 patients)
— 2.2% more full than Alabama overall
– Cases per 100k in last 7 days: 1,828 (12,039 cases)
– Population that is fully vaccinated: 56.0% (368,763 fully vaccinated)
— 13.6% higher vaccination rate than Alabama

Jodybwiki // Wikimedia Commons
#12. Baldwin County, AL
– Inpatient beds occupied: 84.0% (26.0% by COVID-19 patients)
— 6.3% more full than Alabama overall
– ICU beds occupied: 95.0% (44.0% by COVID-19 patients)
— 3.3% more full than Alabama overall
– Cases per 100k in last 7 days: 1,575 (3,517 cases)
– Population that is fully vaccinated: 49.3% (110,120 fully vaccinated)
— 0.0% lower vaccination rate than Alabama

Rudi Weikard // Wikimedia Commons
#11. Blount County, AL
– Inpatient beds occupied: 85.0% (23.0% by COVID-19 patients)
— 7.6% more full than Alabama overall
– ICU beds occupied: 95.0% (60.0% by COVID-19 patients)
— 3.3% more full than Alabama overall
– Cases per 100k in last 7 days: 1,447 (837 cases)
– Population that is fully vaccinated: 30.7% (17,781 fully vaccinated)
— -37.7% lower vaccination rate than Alabama

Altairisfar // Wikicommons
#10. Mobile County, AL
– Inpatient beds occupied: 86.0% (19.0% by COVID-19 patients)
— 8.9% more full than Alabama overall
– ICU beds occupied: 91.0% (28.0% by COVID-19 patients)
— 1.1% more availability than Alabama overall
– Cases per 100k in last 7 days: 1,606 (6,635 cases)
– Population that is fully vaccinated: 48.0% (198,412 fully vaccinated)
— -2.6% lower vaccination rate than Alabama

Calvin Beale // Wikimedia Commons
#9. Coffee County, AL
– Inpatient beds occupied: 87.0% (30.0% by COVID-19 patients)
— 10.1% more full than Alabama overall
– ICU beds occupied: 94.0% (65.0% by COVID-19 patients)
— 2.2% more full than Alabama overall
– Cases per 100k in last 7 days: 1,926 (1,008 cases)
– Population that is fully vaccinated: 45.6% (23,878 fully vaccinated)
— -7.5% lower vaccination rate than Alabama

Chris Pruitt // Wikimedia Commons
#8. Cullman County, AL
– Inpatient beds occupied: 88.0% (38.0% by COVID-19 patients)
— 11.4% more full than Alabama overall
– ICU beds occupied: 92.0% (62.0% by COVID-19 patients)
— 0.0% more availability than Alabama overall
– Cases per 100k in last 7 days: 2,372 (1,987 cases)
– Population that is fully vaccinated: 37.3% (31,283 fully vaccinated)
— -24.3% lower vaccination rate than Alabama

Rivers Langley; SaveRivers // Wikimedia Commons
#7. Calhoun County, AL
– Inpatient beds occupied: 89.0% (14.0% by COVID-19 patients)
— 12.7% more full than Alabama overall
– ICU beds occupied: 100.0% (21.0% by COVID-19 patients)
— 8.7% more full than Alabama overall
– Cases per 100k in last 7 days: 1,707 (1,939 cases)
– Population that is fully vaccinated: 45.5% (51,747 fully vaccinated)
— -7.7% lower vaccination rate than Alabama

Pixabay
#6. Madison County, AL
– Inpatient beds occupied: 90.0% (23.0% by COVID-19 patients)
— 13.9% more full than Alabama overall
– ICU beds occupied: 95.0% (38.0% by COVID-19 patients)
— 3.3% more full than Alabama overall
– Cases per 100k in last 7 days: 1,914 (7,139 cases)
– Population that is fully vaccinated: 59.9% (223,363 fully vaccinated)
— 21.5% higher vaccination rate than Alabama

Wayne James // Shutterstock
#5. Lauderdale County, AL
– Inpatient beds occupied: 91.0% (18.0% by COVID-19 patients)
— 15.2% more full than Alabama overall
– ICU beds occupied: 71.0% (19.0% by COVID-19 patients)
— 22.8% more availability than Alabama overall
– Cases per 100k in last 7 days: 2,389 (2,215 cases)
– Population that is fully vaccinated: 45.0% (41,683 fully vaccinated)
— -8.7% lower vaccination rate than Alabama

Carol M. Highsmith/Library of Congress // Wikimedia Commons
#4. Houston County, AL
– Inpatient beds occupied: 91.0% (20.0% by COVID-19 patients)
— 15.2% more full than Alabama overall
– ICU beds occupied: 102.0% (33.0% by COVID-19 patients)
— 10.9% more full than Alabama overall
– Cases per 100k in last 7 days: 1,410 (1,493 cases)
– Population that is fully vaccinated: 41.9% (44,386 fully vaccinated)
— -15.0% lower vaccination rate than Alabama

Library of Congress
#3. Lee County, AL
– Inpatient beds occupied: 92.0% (31.0% by COVID-19 patients)
— 16.5% more full than Alabama overall
– ICU beds occupied: 99.0% (52.0% by COVID-19 patients)
— 7.6% more full than Alabama overall
– Cases per 100k in last 7 days: 1,454 (2,392 cases)
– Population that is fully vaccinated: 38.8% (63,853 fully vaccinated)
— -21.3% lower vaccination rate than Alabama

Rivers Langley; SaveRivers // Wikimedia Commons
#2. Chambers County, AL
– Inpatient beds occupied: 95.0% (26.0% by COVID-19 patients)
— 20.3% more full than Alabama overall
– ICU beds occupied: data not available
— 92% full in Alabama overall
– Cases per 100k in last 7 days: 1,365 (454 cases)
– Population that is fully vaccinated: 30.2% (10,051 fully vaccinated)
— -38.7% lower vaccination rate than Alabama

Rudi Weikard // Wikimedia Commons
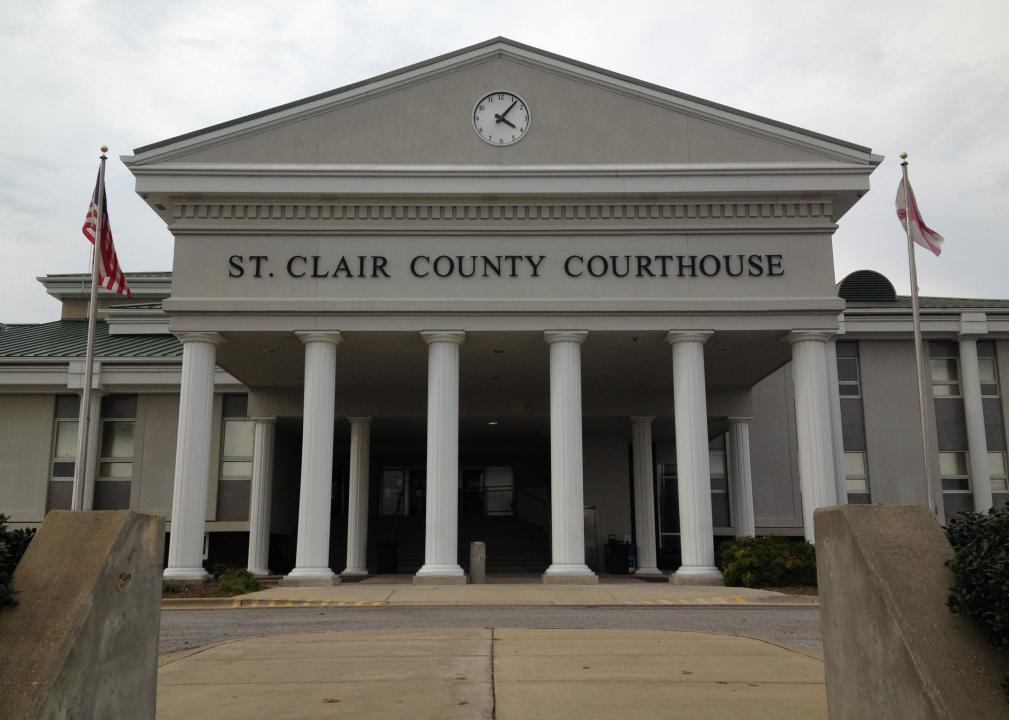
#1. St. Clair County, AL
– Inpatient beds occupied: 101.0% (43.0% by COVID-19 patients)
— 27.8% more full than Alabama overall
– ICU beds occupied: 100.0% (57.0% by COVID-19 patients)
— 8.7% more full than Alabama overall
– Cases per 100k in last 7 days: 1,922 (1,720 cases)
– Population that is fully vaccinated: 38.0% (34,046 fully vaccinated)
— -22.9% lower vaccination rate than Alabama


