Counties with the lowest hospital bed capacity in Alabama
Published 1:25 pm Friday, January 14, 2022
Rudi Weikard // Wikimedia Commons
Counties with the lowest hospital bed capacity in Alabama
The vaccine deployment in December 2020 signaled a turning point in the COVID-19 pandemic. By the end of May 2021, 40% of the U.S. population was fully vaccinated. But as vaccination rates lagged over the summer, new surges of COVID-19 came, including Delta in the summer of 2021, and now the Omicron variant, which comprises the majority of cases in the U.S.
Researchers around the world have reported that Omicron is more transmissible than Delta, making breakthrough and repeat infections more likely. Early research suggests this strain may cause less severe illness than Delta and the original virus, however, health officials have warned an Omicron-driven surge could still increase hospitalization and death rates—especially in areas with less vaccinated populations.
The United States as of Jan. 13 reached 845,707 COVID-19-related deaths and 63.3 million COVID-19 cases, according to Johns Hopkins University. Currently, 62.7% of the population is fully vaccinated, and 37% have received booster doses.
Stacker compiled a list of the counties with the lowest in-patient bed capacity in Alabama using data from the U.S. Department of Health & Human Services and vaccination data from Covid Act Now. Counties are ranked by the percent of in-patient hospital beds filled as of Jan. 12, with ICU availability serving as a tiebreaker. Hospitalization data was available for about 77% of counties in the U.S. Keep reading to see what hospital capacity looks like in your county.
![]()

Carol M. Highsmith // Wikimedia Commons
#50. Monroe County, AL
– Inpatient beds occupied: 37.0% (7.0% by COVID-19 patients)
— 51.3% more availability than Alabama overall
– ICU beds occupied: 64.0% (18.0% by COVID-19 patients)
— 27.3% more availability than Alabama overall
– Cases per 100k in last 7 days: 1,582 (328 cases)
– Population that is fully vaccinated: 42.0% (8,700 fully vaccinated)
— -12.9% lower vaccination rate than Alabama
JNix // Shutterstock
#49. Clay County, AL
– Inpatient beds occupied: 37.0% (6.0% by COVID-19 patients)
— 51.3% more availability than Alabama overall
– ICU beds occupied: 96.0% (67.0% by COVID-19 patients)
— 9.1% more full than Alabama overall
– Cases per 100k in last 7 days: 1,715 (227 cases)
– Population that is fully vaccinated: 41.1% (5,443 fully vaccinated)
— -14.7% lower vaccination rate than Alabama
Canva
#48. Greene County, AL
– Inpatient beds occupied: 39.0% (0.0% by COVID-19 patients)
— 48.7% more availability than Alabama overall
– ICU beds occupied: data not available
— 88% full in Alabama overall
– Cases per 100k in last 7 days: 1,122 (91 cases)
– Population that is fully vaccinated: 48.6% (3,938 fully vaccinated)
— 0.8% higher vaccination rate than Alabama
Canva
#47. Winston County, AL
– Inpatient beds occupied: 39.0% (9.0% by COVID-19 patients)
— 48.7% more availability than Alabama overall
– ICU beds occupied: data not available
— 88% full in Alabama overall
– Cases per 100k in last 7 days: 990 (234 cases)
– Population that is fully vaccinated: 21.3% (5,032 fully vaccinated)
— -55.8% lower vaccination rate than Alabama
Rivers Langley; SaveRivers // Wikimedia Commons
#46. Crenshaw County, AL
– Inpatient beds occupied: 42.0% (7.0% by COVID-19 patients)
— 44.7% more availability than Alabama overall
– ICU beds occupied: data not available
— 88% full in Alabama overall
– Cases per 100k in last 7 days: 1,459 (201 cases)
– Population that is fully vaccinated: 32.9% (4,526 fully vaccinated)
— -31.7% lower vaccination rate than Alabama
Carol M. Highsmith // Wikimedia Commons
#45. Hale County, AL
– Inpatient beds occupied: 42.0% (15.0% by COVID-19 patients)
— 44.7% more availability than Alabama overall
– ICU beds occupied: data not available
— 88% full in Alabama overall
– Cases per 100k in last 7 days: 1,713 (251 cases)
– Population that is fully vaccinated: 58.6% (8,579 fully vaccinated)
— 21.6% higher vaccination rate than Alabama
Canva
#44. Fayette County, AL
– Inpatient beds occupied: 43.0% (3.0% by COVID-19 patients)
— 43.4% more availability than Alabama overall
– ICU beds occupied: 0.0% (0.0% by COVID-19 patients)
— 100.0% more availability than Alabama overall
– Cases per 100k in last 7 days: 902 (147 cases)
– Population that is fully vaccinated: 33.4% (5,438 fully vaccinated)
— -30.7% lower vaccination rate than Alabama
Rudi Weikard // Wikimedia Commons
#43. Marion County, AL
– Inpatient beds occupied: 43.0% (5.0% by COVID-19 patients)
— 43.4% more availability than Alabama overall
– ICU beds occupied: 61.0% (7.0% by COVID-19 patients)
— 30.7% more availability than Alabama overall
– Cases per 100k in last 7 days: 1,043 (310 cases)
– Population that is fully vaccinated: 35.2% (10,452 fully vaccinated)
— -27.0% lower vaccination rate than Alabama
Canva
#42. Chilton County, AL
– Inpatient beds occupied: 44.0% (16.0% by COVID-19 patients)
— 42.1% more availability than Alabama overall
– ICU beds occupied: 43.0% (36.0% by COVID-19 patients)
— 51.1% more availability than Alabama overall
– Cases per 100k in last 7 days: 1,146 (509 cases)
– Population that is fully vaccinated: 34.7% (15,415 fully vaccinated)
— -28.0% lower vaccination rate than Alabama
Rudi Weikard // Wikimedia Commons
#41. Blount County, AL
– Inpatient beds occupied: 44.0% (9.0% by COVID-19 patients)
— 42.1% more availability than Alabama overall
– ICU beds occupied: 57.0% (0.0% by COVID-19 patients)
— 35.2% more availability than Alabama overall
– Cases per 100k in last 7 days: 925 (535 cases)
– Population that is fully vaccinated: 29.9% (17,282 fully vaccinated)
— -38.0% lower vaccination rate than Alabama
Springfieldohio // Wikimedia Commons
#40. Jackson County, AL
– Inpatient beds occupied: 45.0% (6.0% by COVID-19 patients)
— 40.8% more availability than Alabama overall
– ICU beds occupied: 61.0% (24.0% by COVID-19 patients)
— 30.7% more availability than Alabama overall
– Cases per 100k in last 7 days: 895 (462 cases)
– Population that is fully vaccinated: 46.7% (24,090 fully vaccinated)
— -3.1% lower vaccination rate than Alabama
Canva
#39. Bibb County, AL
– Inpatient beds occupied: 45.0% (4.0% by COVID-19 patients)
— 40.8% more availability than Alabama overall
– ICU beds occupied: data not available
— 88% full in Alabama overall
– Cases per 100k in last 7 days: 1,746 (391 cases)
– Population that is fully vaccinated: 33.0% (7,398 fully vaccinated)
— -31.5% lower vaccination rate than Alabama
Kreeder13 // Wikimedia Commons
#38. Pike County, AL
– Inpatient beds occupied: 46.0% (2.0% by COVID-19 patients)
— 39.5% more availability than Alabama overall
– ICU beds occupied: 60.0% (2.0% by COVID-19 patients)
— 31.8% more availability than Alabama overall
– Cases per 100k in last 7 days: 1,018 (337 cases)
– Population that is fully vaccinated: 39.8% (13,189 fully vaccinated)
— -17.4% lower vaccination rate than Alabama
Chris Pruitt // Wikimedia Commons
#37. Conecuh County, AL
– Inpatient beds occupied: 46.0% (10.0% by COVID-19 patients)
— 39.5% more availability than Alabama overall
– ICU beds occupied: data not available
— 88% full in Alabama overall
– Cases per 100k in last 7 days: 1,541 (186 cases)
– Population that is fully vaccinated: 40.8% (4,918 fully vaccinated)
— -15.4% lower vaccination rate than Alabama
Canva
#36. Escambia County, AL
– Inpatient beds occupied: 47.0% (11.0% by COVID-19 patients)
— 38.2% more availability than Alabama overall
– ICU beds occupied: 49.0% (13.0% by COVID-19 patients)
— 44.3% more availability than Alabama overall
– Cases per 100k in last 7 days: 1,545 (566 cases)
– Population that is fully vaccinated: 34.9% (12,785 fully vaccinated)
— -27.6% lower vaccination rate than Alabama
DXR // Wikimedia Commons
#35. Dallas County, AL
– Inpatient beds occupied: 48.0% (3.0% by COVID-19 patients)
— 36.8% more availability than Alabama overall
– ICU beds occupied: 69.0% (0.0% by COVID-19 patients)
— 21.6% more availability than Alabama overall
– Cases per 100k in last 7 days: 1,492 (555 cases)
– Population that is fully vaccinated: 43.1% (16,042 fully vaccinated)
— -10.6% lower vaccination rate than Alabama
Rivers A. Langley; SaveRivers // Wikimedia Commons
#34. Tallapoosa County, AL
– Inpatient beds occupied: 48.0% (14.0% by COVID-19 patients)
— 36.8% more availability than Alabama overall
– ICU beds occupied: 102.0% (64.0% by COVID-19 patients)
— 15.9% more full than Alabama overall
– Cases per 100k in last 7 days: 1,784 (720 cases)
– Population that is fully vaccinated: 37.3% (15,067 fully vaccinated)
— -22.6% lower vaccination rate than Alabama
Wmr36104 // Wikimedia Commons
#33. Geneva County, AL
– Inpatient beds occupied: 50.0% (3.0% by COVID-19 patients)
— 34.2% more availability than Alabama overall
– ICU beds occupied: 40.0% (0.0% by COVID-19 patients)
— 54.5% more availability than Alabama overall
– Cases per 100k in last 7 days: 636 (167 cases)
– Population that is fully vaccinated: 36.9% (9,681 fully vaccinated)
— -23.4% lower vaccination rate than Alabama
Rudi Weikard // Wikimedia Commons
#32. Franklin County, AL
– Inpatient beds occupied: 52.0% (3.0% by COVID-19 patients)
— 31.6% more availability than Alabama overall
– ICU beds occupied: 24.0% (0.0% by COVID-19 patients)
— 72.7% more availability than Alabama overall
– Cases per 100k in last 7 days: 1,030 (323 cases)
– Population that is fully vaccinated: 41.7% (13,081 fully vaccinated)
— -13.5% lower vaccination rate than Alabama
Michael Rivera // Wikimedia Commons
#31. Dale County, AL
– Inpatient beds occupied: 55.0% (10.0% by COVID-19 patients)
— 27.6% more availability than Alabama overall
– ICU beds occupied: 77.0% (23.0% by COVID-19 patients)
— 12.5% more availability than Alabama overall
– Cases per 100k in last 7 days: 1,194 (587 cases)
– Population that is fully vaccinated: 51.8% (25,468 fully vaccinated)
— 7.5% higher vaccination rate than Alabama
Chris Pruitt // Wikimedia Commons
#30. Butler County, AL
– Inpatient beds occupied: 56.0% (11.0% by COVID-19 patients)
— 26.3% more availability than Alabama overall
– ICU beds occupied: 67.0% (0.0% by COVID-19 patients)
— 23.9% more availability than Alabama overall
– Cases per 100k in last 7 days: 1,759 (342 cases)
– Population that is fully vaccinated: 37.6% (7,306 fully vaccinated)
— -22.0% lower vaccination rate than Alabama
Canva
#29. Walker County, AL
– Inpatient beds occupied: 56.0% (12.0% by COVID-19 patients)
— 26.3% more availability than Alabama overall
– ICU beds occupied: 99.0% (51.0% by COVID-19 patients)
— 12.5% more full than Alabama overall
– Cases per 100k in last 7 days: 981 (623 cases)
– Population that is fully vaccinated: 45.5% (28,896 fully vaccinated)
— -5.6% lower vaccination rate than Alabama
Rivers A. Langley; SaveRivers // Wikimedia Commons
#28. Randolph County, AL
– Inpatient beds occupied: 56.0% (1.0% by COVID-19 patients)
— 26.3% more availability than Alabama overall
– ICU beds occupied: data not available
— 88% full in Alabama overall
– Cases per 100k in last 7 days: 1,162 (264 cases)
– Population that is fully vaccinated: 32.1% (7,291 fully vaccinated)
— -33.4% lower vaccination rate than Alabama
Dailynetworks // Wikimedia Commons
#27. Colbert County, AL
– Inpatient beds occupied: 62.0% (10.0% by COVID-19 patients)
— 18.4% more availability than Alabama overall
– ICU beds occupied: 85.0% (44.0% by COVID-19 patients)
— 3.4% more availability than Alabama overall
– Cases per 100k in last 7 days: 1,504 (831 cases)
– Population that is fully vaccinated: 46.1% (25,444 fully vaccinated)
— -4.4% lower vaccination rate than Alabama
Tracy Burroughs Brown // Shutterstock
#26. Tuscaloosa County, AL
– Inpatient beds occupied: 62.0% (12.0% by COVID-19 patients)
— 18.4% more availability than Alabama overall
– ICU beds occupied: 89.0% (17.0% by COVID-19 patients)
— 1.1% more full than Alabama overall
– Cases per 100k in last 7 days: 1,419 (2,970 cases)
– Population that is fully vaccinated: 41.8% (87,411 fully vaccinated)
— -13.3% lower vaccination rate than Alabama
Canva
#25. DeKalb County, AL
– Inpatient beds occupied: 65.0% (8.0% by COVID-19 patients)
— 14.5% more availability than Alabama overall
– ICU beds occupied: 84.0% (19.0% by COVID-19 patients)
— 4.5% more availability than Alabama overall
– Cases per 100k in last 7 days: 935 (669 cases)
– Population that is fully vaccinated: 32.3% (23,126 fully vaccinated)
— -33.0% lower vaccination rate than Alabama
Carol M. Highsmith // Wikimedia Commons
#24. Limestone County, AL
– Inpatient beds occupied: 65.0% (14.0% by COVID-19 patients)
— 14.5% more availability than Alabama overall
– ICU beds occupied: 94.0% (40.0% by COVID-19 patients)
— 6.8% more full than Alabama overall
– Cases per 100k in last 7 days: 1,338 (1,323 cases)
– Population that is fully vaccinated: 35.0% (34,593 fully vaccinated)
— -27.4% lower vaccination rate than Alabama
Rivers Langley; SaveRivers // Wikimedia Commons
#23. Barbour County, AL
– Inpatient beds occupied: 66.0% (8.0% by COVID-19 patients)
— 13.2% more availability than Alabama overall
– ICU beds occupied: 73.0% (0.0% by COVID-19 patients)
— 17.0% more availability than Alabama overall
– Cases per 100k in last 7 days: 1,523 (376 cases)
– Population that is fully vaccinated: 42.4% (10,470 fully vaccinated)
— -12.0% lower vaccination rate than Alabama
MPearsallArt // Wikimedia Commons
#22. Morgan County, AL
– Inpatient beds occupied: 66.0% (15.0% by COVID-19 patients)
— 13.2% more availability than Alabama overall
– ICU beds occupied: 77.0% (31.0% by COVID-19 patients)
— 12.5% more availability than Alabama overall
– Cases per 100k in last 7 days: 1,433 (1,715 cases)
– Population that is fully vaccinated: 41.7% (49,947 fully vaccinated)
— -13.5% lower vaccination rate than Alabama
Rivers Langley; SaveRivers // Wikimedia Commons
#21. Talladega County, AL
– Inpatient beds occupied: 67.0% (8.0% by COVID-19 patients)
— 11.8% more availability than Alabama overall
– ICU beds occupied: 74.0% (22.0% by COVID-19 patients)
— 15.9% more availability than Alabama overall
– Cases per 100k in last 7 days: 1,634 (1,307 cases)
– Population that is fully vaccinated: 35.2% (28,178 fully vaccinated)
— -27.0% lower vaccination rate than Alabama
Canva
#20. Marshall County, AL
– Inpatient beds occupied: 67.0% (15.0% by COVID-19 patients)
— 11.8% more availability than Alabama overall
– ICU beds occupied: 77.0% (26.0% by COVID-19 patients)
— 12.5% more availability than Alabama overall
– Cases per 100k in last 7 days: 1,099 (1,064 cases)
– Population that is fully vaccinated: 43.6% (42,211 fully vaccinated)
— -9.5% lower vaccination rate than Alabama
Rivers Langley; SaveRivers // Wikimedia Commons
#19. Shelby County, AL
– Inpatient beds occupied: 68.0% (9.0% by COVID-19 patients)
— 10.5% more availability than Alabama overall
– ICU beds occupied: 73.0% (10.0% by COVID-19 patients)
— 17.0% more availability than Alabama overall
– Cases per 100k in last 7 days: 1,484 (3,231 cases)
– Population that is fully vaccinated: 34.5% (75,117 fully vaccinated)
— -28.4% lower vaccination rate than Alabama
Chris Pruitt // Wikimedia Commons
#18. Covington County, AL
– Inpatient beds occupied: 68.0% (6.0% by COVID-19 patients)
— 10.5% more availability than Alabama overall
– ICU beds occupied: 82.0% (9.0% by COVID-19 patients)
— 6.8% more availability than Alabama overall
– Cases per 100k in last 7 days: 823 (305 cases)
– Population that is fully vaccinated: 36.7% (13,581 fully vaccinated)
— -23.9% lower vaccination rate than Alabama
Rivers Langley SaveRivers // Wikimedia Commons
#17. Russell County, AL
– Inpatient beds occupied: 69.0% (9.0% by COVID-19 patients)
— 9.2% more availability than Alabama overall
– ICU beds occupied: 93.0% (36.0% by COVID-19 patients)
— 5.7% more full than Alabama overall
– Cases per 100k in last 7 days: 906 (525 cases)
– Population that is fully vaccinated: 38.3% (22,189 fully vaccinated)
— -20.5% lower vaccination rate than Alabama
Rivers Langley; SaveRivers // Wikimedia Commons
#16. Chambers County, AL
– Inpatient beds occupied: 70.0% (6.0% by COVID-19 patients)
— 7.9% more availability than Alabama overall
– ICU beds occupied: data not available
— 88% full in Alabama overall
– Cases per 100k in last 7 days: 1,822 (606 cases)
– Population that is fully vaccinated: 29.8% (9,896 fully vaccinated)
— -38.2% lower vaccination rate than Alabama
Canva
#15. Marengo County, AL
– Inpatient beds occupied: 71.0% (15.0% by COVID-19 patients)
— 6.6% more availability than Alabama overall
– ICU beds occupied: 124.0% (36.0% by COVID-19 patients)
— 40.9% more full than Alabama overall
– Cases per 100k in last 7 days: 1,203 (227 cases)
– Population that is fully vaccinated: 52.2% (9,842 fully vaccinated)
— 8.3% higher vaccination rate than Alabama
Prestinian // Wikimedia Commons
#14. Etowah County, AL
– Inpatient beds occupied: 73.0% (13.0% by COVID-19 patients)
— 3.9% more availability than Alabama overall
– ICU beds occupied: 97.0% (30.0% by COVID-19 patients)
— 10.2% more full than Alabama overall
– Cases per 100k in last 7 days: 1,159 (1,185 cases)
– Population that is fully vaccinated: 39.5% (40,384 fully vaccinated)
— -18.0% lower vaccination rate than Alabama
Calvin Beale // Wikimedia Commons
#13. Coffee County, AL
– Inpatient beds occupied: 75.0% (9.0% by COVID-19 patients)
— 1.3% more availability than Alabama overall
– ICU beds occupied: 57.0% (11.0% by COVID-19 patients)
— 35.2% more availability than Alabama overall
– Cases per 100k in last 7 days: 1,251 (655 cases)
– Population that is fully vaccinated: 38.3% (20,072 fully vaccinated)
— -20.5% lower vaccination rate than Alabama
Chris Pruitt // Wikimedia Commons
#12. Cullman County, AL
– Inpatient beds occupied: 76.0% (20.0% by COVID-19 patients)
— 0.0% more availability than Alabama overall
– ICU beds occupied: 79.0% (25.0% by COVID-19 patients)
— 10.2% more availability than Alabama overall
– Cases per 100k in last 7 days: 1,240 (1,039 cases)
– Population that is fully vaccinated: 36.7% (30,780 fully vaccinated)
— -23.9% lower vaccination rate than Alabama
Chris Pruitt // wikicommons
#11. Montgomery County, AL
– Inpatient beds occupied: 76.0% (15.0% by COVID-19 patients)
— 0.0% more availability than Alabama overall
– ICU beds occupied: 97.0% (22.0% by COVID-19 patients)
— 10.2% more full than Alabama overall
– Cases per 100k in last 7 days: 1,933 (4,378 cases)
– Population that is fully vaccinated: 50.8% (115,058 fully vaccinated)
— 5.4% higher vaccination rate than Alabama
Jodybwiki // Wikimedia Commons
#10. Baldwin County, AL
– Inpatient beds occupied: 80.0% (10.0% by COVID-19 patients)
— 5.3% more full than Alabama overall
– ICU beds occupied: 95.0% (22.0% by COVID-19 patients)
— 8.0% more full than Alabama overall
– Cases per 100k in last 7 days: 1,370 (3,058 cases)
– Population that is fully vaccinated: 48.1% (107,363 fully vaccinated)
— -0.2% lower vaccination rate than Alabama
M Floyd // Flickr
#9. Jefferson County, AL
– Inpatient beds occupied: 82.0% (11.0% by COVID-19 patients)
— 7.9% more full than Alabama overall
– ICU beds occupied: 91.0% (18.0% by COVID-19 patients)
— 3.4% more full than Alabama overall
– Cases per 100k in last 7 days: 1,852 (12,198 cases)
– Population that is fully vaccinated: 55.0% (362,099 fully vaccinated)
— 14.1% higher vaccination rate than Alabama
Altairisfar // Wikicommons
#8. Mobile County, AL
– Inpatient beds occupied: 85.0% (11.0% by COVID-19 patients)
— 11.8% more full than Alabama overall
– ICU beds occupied: 87.0% (15.0% by COVID-19 patients)
— 1.1% more availability than Alabama overall
– Cases per 100k in last 7 days: 1,910 (7,891 cases)
– Population that is fully vaccinated: 47.2% (194,882 fully vaccinated)
— -2.1% lower vaccination rate than Alabama
Chris Pruitt // Wikimedia Commons
#7. Autauga County, AL
– Inpatient beds occupied: 85.0% (30.0% by COVID-19 patients)
— 11.8% more full than Alabama overall
– ICU beds occupied: 133.0% (33.0% by COVID-19 patients)
— 51.1% more full than Alabama overall
– Cases per 100k in last 7 days: 1,351 (755 cases)
– Population that is fully vaccinated: 38.9% (21,731 fully vaccinated)
— -19.3% lower vaccination rate than Alabama
Pixabay
#6. Madison County, AL
– Inpatient beds occupied: 87.0% (12.0% by COVID-19 patients)
— 14.5% more full than Alabama overall
– ICU beds occupied: 92.0% (20.0% by COVID-19 patients)
— 4.5% more full than Alabama overall
– Cases per 100k in last 7 days: 1,511 (5,635 cases)
– Population that is fully vaccinated: 58.1% (216,554 fully vaccinated)
— 20.5% higher vaccination rate than Alabama
Library of Congress
#5. Lee County, AL
– Inpatient beds occupied: 90.0% (16.0% by COVID-19 patients)
— 18.4% more full than Alabama overall
– ICU beds occupied: 99.0% (34.0% by COVID-19 patients)
— 12.5% more full than Alabama overall
– Cases per 100k in last 7 days: 1,501 (2,469 cases)
– Population that is fully vaccinated: 36.9% (60,697 fully vaccinated)
— -23.4% lower vaccination rate than Alabama
Wayne James // Shutterstock
#4. Lauderdale County, AL
– Inpatient beds occupied: 91.0% (10.0% by COVID-19 patients)
— 19.7% more full than Alabama overall
– ICU beds occupied: 79.0% (12.0% by COVID-19 patients)
— 10.2% more availability than Alabama overall
– Cases per 100k in last 7 days: 1,426 (1,322 cases)
– Population that is fully vaccinated: 44.3% (41,047 fully vaccinated)
— -8.1% lower vaccination rate than Alabama
Carol M. Highsmith/Library of Congress // Wikimedia Commons
#3. Houston County, AL
– Inpatient beds occupied: 91.0% (10.0% by COVID-19 patients)
— 19.7% more full than Alabama overall
– ICU beds occupied: 101.0% (15.0% by COVID-19 patients)
— 14.8% more full than Alabama overall
– Cases per 100k in last 7 days: 1,000 (1,059 cases)
– Population that is fully vaccinated: 41.3% (43,749 fully vaccinated)
— -14.3% lower vaccination rate than Alabama
Rivers Langley; SaveRivers // Wikimedia Commons
#2. Calhoun County, AL
– Inpatient beds occupied: 97.0% (11.0% by COVID-19 patients)
— 27.6% more full than Alabama overall
– ICU beds occupied: 93.0% (19.0% by COVID-19 patients)
— 5.7% more full than Alabama overall
– Cases per 100k in last 7 days: 1,152 (1,309 cases)
– Population that is fully vaccinated: 45.5% (51,705 fully vaccinated)
— -5.6% lower vaccination rate than Alabama
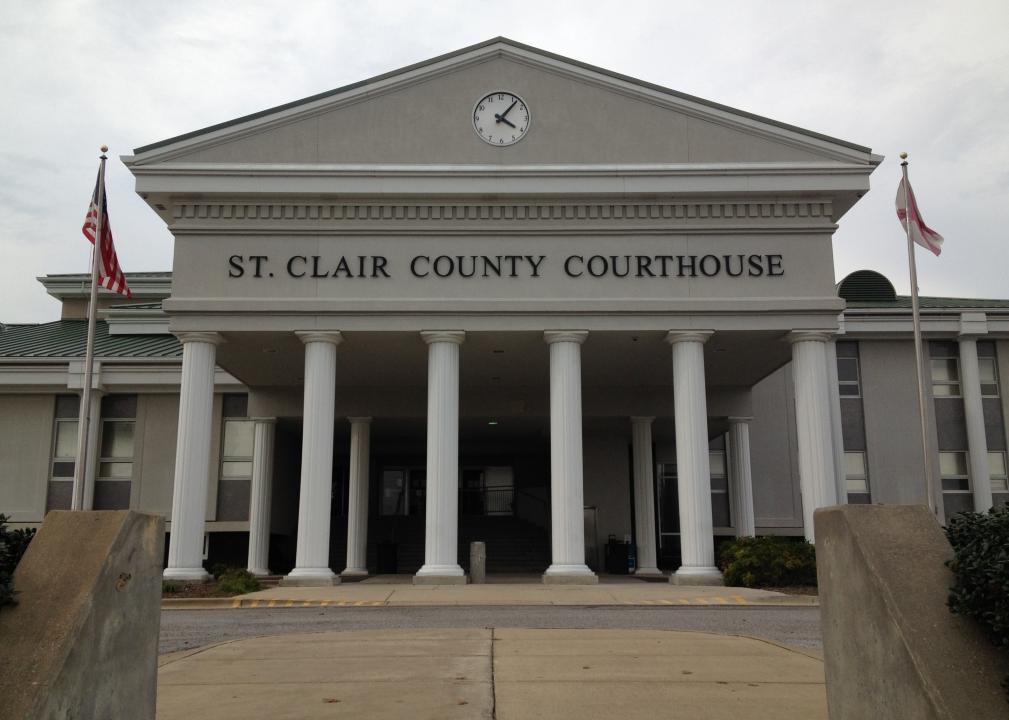
Rudi Weikard // Wikimedia Commons
#1. St. Clair County, AL
– Inpatient beds occupied: 97.0% (28.0% by COVID-19 patients)
— 27.6% more full than Alabama overall
– ICU beds occupied: 95.0% (33.0% by COVID-19 patients)
— 8.0% more full than Alabama overall
– Cases per 100k in last 7 days: 1,637 (1,465 cases)
– Population that is fully vaccinated: 37.5% (33,528 fully vaccinated)
— -22.2% lower vaccination rate than Alabama