Where people in Mobile are moving to most
Published 3:05 pm Tuesday, January 11, 2022
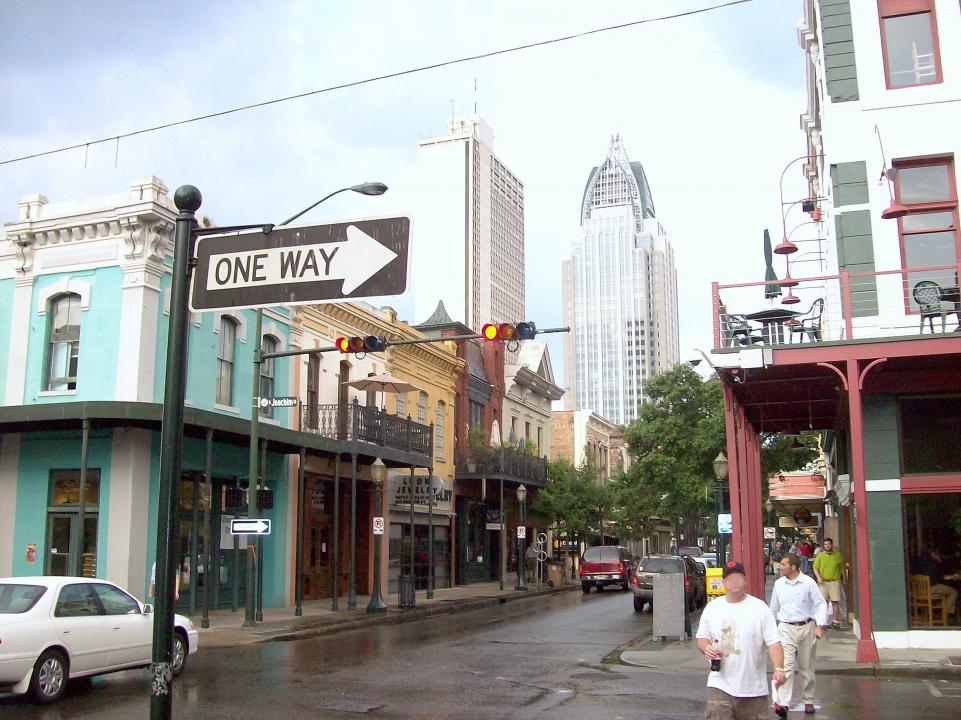
Altairisfar // Wikicommons
Where people in Mobile are moving to most
Stacker compiled a list of where people in Mobile, AL Metro Area are moving to the most using data from the U.S. Census Bureau. Metros are ranked by the estimated number of people who moved to the metro from Mobile between 2015 and 2019. Ties were broken by gross migration.
You may also like: Highest-rated seafood restaurants in Mobile, according to Tripadvisor
![]()

Songquan Deng // Shutterstock
#50. Orlando-Kissimmee-Sanford, FL Metro Area
– Migration to Orlando in 2015-2019: 39
– Migration from Orlando to Mobile: 22 (#221 most common destination from Orlando)
– Net migration: 17 to Orlando
Kristin Nador // Flickr
#49. Wichita, KS Metro Area
– Migration to Wichita in 2015-2019: 42
– Migration from Wichita to Mobile: 18 (#110 most common destination from Wichita)
– Net migration: 24 to Wichita
Ron Reiring // Wikicommons
#48. Spokane-Spokane Valley, WA Metro Area
– Migration to Spokane in 2015-2019: 44
– Migration from Spokane to Mobile: 0
– Net migration: 44 to Spokane
Andrew Bossi // Wikimedia
#47. Washington-Arlington-Alexandria, DC-VA-MD-WV Metro Area
– Migration to Washington in 2015-2019: 46
– Migration from Washington to Mobile: 446 (#101 most common destination from Washington)
– Net migration: 400 to Mobile
Alvesgaspar // Wikimedia
#46. Tampa-St. Petersburg-Clearwater, FL Metro Area
– Migration to Tampa in 2015-2019: 51
– Migration from Tampa to Mobile: 72 (#167 most common destination from Tampa)
– Net migration: 21 to Mobile
You may also like: Dogs available for adoption in Mobile

Explorecdale // Wikimedia Commons
#45. Carbondale-Marion, IL Metro Area
– Migration to Carbondale in 2015-2019: 52
– Migration from Carbondale to Mobile: 0
– Net migration: 52 to Carbondale
Pixabay
#44. Greeley, CO Metro Area
– Migration to Greeley in 2015-2019: 54
– Migration from Greeley to Mobile: 0
– Net migration: 54 to Greeley
Sean Pavone // Shutterstock
#43. Shreveport-Bossier City, LA Metro Area
– Migration to Shreveport in 2015-2019: 60
– Migration from Shreveport to Mobile: 7 (#118 most common destination from Shreveport)
– Net migration: 53 to Shreveport
nickchapman // Wikicommons
#42. Bakersfield, CA Metro Area
– Migration to Bakersfield in 2015-2019: 66
– Migration from Bakersfield to Mobile: 50 (#75 most common destination from Bakersfield)
– Net migration: 16 to Bakersfield
PhotosByMahin // Pixabay
#41. Detroit-Warren-Dearborn, MI Metro Area
– Migration to Detroit in 2015-2019: 66
– Migration from Detroit to Mobile: 1 (#287 most common destination from Detroit)
– Net migration: 65 to Detroit
You may also like: Metros where people in Mobile are getting new jobs

Noel Pennington//Flickr
#40. Memphis, TN-MS-AR Metro Area
– Migration to Memphis in 2015-2019: 67
– Migration from Memphis to Mobile: 10 (#202 most common destination from Memphis)
– Net migration: 57 to Memphis
Sean Pavone // Shutterstock
#39. Columbus, OH Metro Area
– Migration to Columbus in 2015-2019: 68
– Migration from Columbus to Mobile: 0
– Net migration: 68 to Columbus
Sean Pavone // Shutterstock
#38. St. Louis, MO-IL Metro Area
– Migration to St. Louis in 2015-2019: 68
– Migration from St. Louis to Mobile: 21 (#233 most common destination from St. Louis)
– Net migration: 47 to St. Louis
MicheleHaro // Wikimedia
#37. Palm Bay-Melbourne-Titusville, FL Metro Area
– Migration to Palm Bay in 2015-2019: 75
– Migration from Palm Bay to Mobile: 0
– Net migration: 75 to Palm Bay
en:User:Paul.h // Wikimedia
#36. San Francisco-Oakland-Berkeley, CA Metro Area
– Migration to San Francisco in 2015-2019: 77
– Migration from San Francisco to Mobile: 72 (#146 most common destination from San Francisco)
– Net migration: 5 to San Francisco
You may also like: Highest-paying jobs in Mobile

Tony Webster // Wikicommons
#35. Minneapolis-St. Paul-Bloomington, MN-WI Metro Area
– Migration to Minneapolis in 2015-2019: 83
– Migration from Minneapolis to Mobile: 0
– Net migration: 83 to Minneapolis
Patrick Feller//Flickr
#34. Lake Charles, LA Metro Area
– Migration to Lake Charles in 2015-2019: 84
– Migration from Lake Charles to Mobile: 0
– Net migration: 84 to Lake Charles
Billy Hathorn // Wikimedia
#33. Killeen-Temple, TX Metro Area
– Migration to Killeen in 2015-2019: 85
– Migration from Killeen to Mobile: 0
– Net migration: 85 to Killeen
Sturmgewehr88 // Wikimedia
#32. Hattiesburg, MS Metro Area
– Migration to Hattiesburg in 2015-2019: 96
– Migration from Hattiesburg to Mobile: 76 (#18 most common destination from Hattiesburg)
– Net migration: 20 to Hattiesburg
FloridaStock // Shutterstock
#31. Naples-Marco Island, FL Metro Area
– Migration to Naples in 2015-2019: 105
– Migration from Naples to Mobile: 0
– Net migration: 105 to Naples
You may also like: Cities with the fastest growing home prices in Mobile metro area

Stephen Zimmermann // Wikimedia Commons
#30. Buffalo-Cheektowaga, NY Metro Area
– Migration to Buffalo in 2015-2019: 110
– Migration from Buffalo to Mobile: 0
– Net migration: 110 to Buffalo
BusinessEditorUSA // Wikimedia Commons
#29. Charlotte-Concord-Gastonia, NC-SC Metro Area
– Migration to Charlotte in 2015-2019: 113
– Migration from Charlotte to Mobile: 14 (#232 most common destination from Charlotte)
– Net migration: 99 to Charlotte
Ken L. // Flickr
#28. Charleston-North Charleston, SC Metro Area
– Migration to Charleston in 2015-2019: 116
– Migration from Charleston to Mobile: 0
– Net migration: 116 to Charleston
jmd41280 // Flickr
#27. Chambersburg-Waynesboro, PA Metro Area
– Migration to Chambersburg in 2015-2019: 130
– Migration from Chambersburg to Mobile: 0
– Net migration: 130 to Chambersburg
BDS2006 // Wikimedia
#26. Los Angeles-Long Beach-Anaheim, CA Metro Area
– Migration to Los Angeles in 2015-2019: 132
– Migration from Los Angeles to Mobile: 19 (#315 most common destination from Los Angeles)
– Net migration: 113 to Los Angeles
You may also like: Metros sending the most people to Mobile

Sharkshock // Shutterstock
#25. Raleigh-Cary, NC Metro Area
– Migration to Raleigh in 2015-2019: 134
– Migration from Raleigh to Mobile: 0
– Net migration: 134 to Raleigh
Kevin Ruck // Shutterstock
#24. Augusta-Richmond County, GA-SC Metro Area
– Migration to Augusta in 2015-2019: 136
– Migration from Augusta to Mobile: 0
– Net migration: 136 to Augusta
Ebyabe // Wikicommons
#23. Crestview-Fort Walton Beach-Destin, FL Metro Area
– Migration to Crestview in 2015-2019: 144
– Migration from Crestview to Mobile: 79 (#57 most common destination from Crestview)
– Net migration: 65 to Crestview
Christopher & Amy Esposito // Wikicommons
#22. Chicago-Naperville-Elgin, IL-IN-WI Metro Area
– Migration to Chicago in 2015-2019: 147
– Migration from Chicago to Mobile: 76 (#237 most common destination from Chicago)
– Net migration: 71 to Chicago
Richard David Ramsey // Wikimedia Commons
#21. Hammond, LA Metro Area
– Migration to Hammond in 2015-2019: 153
– Migration from Hammond to Mobile: 0
– Net migration: 153 to Hammond
You may also like: Highest paying jobs that require a 2 year degree in Mobile

David Wilson // Flickr
#20. Knoxville, TN Metro Area
– Migration to Knoxville in 2015-2019: 166
– Migration from Knoxville to Mobile: 44 (#96 most common destination from Knoxville)
– Net migration: 122 to Knoxville
Kolossos // Wikimedia Commons
#19. Miami-Fort Lauderdale-Pompano Beach, FL Metro Area
– Migration to Miami in 2015-2019: 184
– Migration from Miami to Mobile: 113 (#154 most common destination from Miami)
– Net migration: 71 to Miami
Blankfaze // Wikimedia Commons
#18. Pensacola-Ferry Pass-Brent, FL Metro Area
– Migration to Pensacola in 2015-2019: 204
– Migration from Pensacola to Mobile: 294 (#23 most common destination from Pensacola)
– Net migration: 90 to Mobile
Sherry V Smith // Shutterstock
#17. Virginia Beach-Norfolk-Newport News, VA-NC Metro Area
– Migration to Virginia Beach in 2015-2019: 224
– Migration from Virginia Beach to Mobile: 29 (#205 most common destination from Virginia Beach)
– Net migration: 195 to Virginia Beach
skeeze // Pixabay
#16. Houston-The Woodlands-Sugar Land, TX Metro Area
– Migration to Houston in 2015-2019: 238
– Migration from Houston to Mobile: 290 (#94 most common destination from Houston)
– Net migration: 52 to Mobile
You may also like: Highest-rated Chinese restaurants in Mobile, according to Tripadvisor

f11photo // Shutterstock
#15. Nashville-Davidson–Murfreesboro–Franklin, TN Metro Area
– Migration to Nashville in 2015-2019: 243
– Migration from Nashville to Mobile: 199 (#61 most common destination from Nashville)
– Net migration: 44 to Nashville
Pedro Szekely // flickr
#14. New Orleans-Metairie, LA Metro Area
– Migration to New Orleans in 2015-2019: 244
– Migration from New Orleans to Mobile: 323 (#32 most common destination from New Orleans)
– Net migration: 79 to Mobile
Michlaovic // Wikimedia
#13. Jackson, MS Metro Area
– Migration to Jackson in 2015-2019: 259
– Migration from Jackson to Mobile: 30 (#89 most common destination from Jackson)
– Net migration: 229 to Jackson
Pixabay
#12. Sacramento-Roseville-Folsom, CA Metro Area
– Migration to Sacramento in 2015-2019: 275
– Migration from Sacramento to Mobile: 0
– Net migration: 275 to Sacramento
Alan Botting // Wikimedia Commons
#11. Dallas-Fort Worth-Arlington, TX Metro Area
– Migration to Dallas in 2015-2019: 295
– Migration from Dallas to Mobile: 80 (#202 most common destination from Dallas)
– Net migration: 215 to Dallas
You may also like: Highest-rated pizza restaurants in Mobile, according to Tripadvisor

Citycommunications // Wikicommons
#10. Fort Collins, CO Metro Area
– Migration to Fort Collins in 2015-2019: 299
– Migration from Fort Collins to Mobile: 0
– Net migration: 299 to Fort Collins
Library of Congress
#9. Auburn-Opelika, AL Metro Area
– Migration to Auburn in 2015-2019: 312
– Migration from Auburn to Mobile: 89 (#24 most common destination from Auburn)
– Net migration: 223 to Auburn
Tracy Burroughs Brown // Shutterstock
#8. Tuscaloosa, AL Metro Area
– Migration to Tuscaloosa in 2015-2019: 426
– Migration from Tuscaloosa to Mobile: 231 (#8 most common destination from Tuscaloosa)
– Net migration: 195 to Tuscaloosa
Philip Lange // Shutterstock
#7. Baton Rouge, LA Metro Area
– Migration to Baton Rouge in 2015-2019: 434
– Migration from Baton Rouge to Mobile: 75 (#49 most common destination from Baton Rouge)
– Net migration: 359 to Baton Rouge
Keizers // Wikimedia Commons
#6. Atlanta-Sandy Springs-Alpharetta, GA Metro Area
– Migration to Atlanta in 2015-2019: 446
– Migration from Atlanta to Mobile: 605 (#71 most common destination from Atlanta)
– Net migration: 159 to Mobile
You may also like: Highest-rated cheap eats in Mobile, according to Tripadvisor

Pixabay
#5. Huntsville, AL Metro Area
– Migration to Huntsville in 2015-2019: 556
– Migration from Huntsville to Mobile: 607 (#7 most common destination from Huntsville)
– Net migration: 51 to Mobile
Woodlot// Wikimedia
#4. Gulfport-Biloxi, MS Metro Area
– Migration to Gulfport in 2015-2019: 595
– Migration from Gulfport to Mobile: 595 (#6 most common destination from Gulfport)
– Net migration: 0 to Mobile
Chris Pruitt // wikicommons
#3. Montgomery, AL Metro Area
– Migration to Montgomery in 2015-2019: 689
– Migration from Montgomery to Mobile: 585 (#5 most common destination from Montgomery)
– Net migration: 104 to Montgomery
M Floyd // Flickr
#2. Birmingham-Hoover, AL Metro Area
– Migration to Birmingham in 2015-2019: 1,189
– Migration from Birmingham to Mobile: 385 (#17 most common destination from Birmingham)
– Net migration: 804 to Birmingham
Jodybwiki // Wikimedia Commons
#1. Daphne-Fairhope-Foley, AL Metro Area
– Migration to Daphne in 2015-2019: 1,647
– Migration from Daphne to Mobile: 1,085 (#1 most common destination from Daphne)
– Net migration: 562 to Daphne
You may also like: Zip codes with the most expensive homes in Mobile metro area