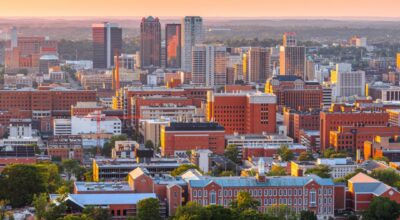
Counties with the lowest hospital bed capacity in Alabama
Published 2:03 pm Friday, December 24, 2021
Carol M. Highsmith/Library of Congress // Wikimedia Commons
Counties with the lowest hospital bed capacity in Alabama
The vaccine deployment in December 2020 signaled a turning point in the COVID-19 pandemic. By the end of May 2021, 40% of the U.S. population was fully vaccinated. But as vaccination rates lagged over the summer, new surges of COVID-19 came, including Delta in the summer of 2021, and now the Omicron variant, which comprises the majority of cases in the U.S.
Researchers around the world have reported that Omicron is more transmissible than Delta, making breakthrough and repeat infections more likely. Early research suggests this strain may cause less severe illness than Delta and the original virus, however, health officials have warned an Omicron-driven surge could still increase hospitalization and death rates—especially in areas with less vaccinated populations.
The United States as of Dec. 23 reached 812,283 COVID-19-related deaths and 51.5 million COVID-19 cases, according to Johns Hopkins University. Currently, 61.7% of the population is fully vaccinated, and 30.8% have received booster doses.
Stacker compiled a list of the counties with the lowest in-patient bed capacity in Alabama using data from the U.S. Department of Health & Human Services. Counties are ranked by the percent of in-patient hospital beds filled as of Dec. 22, with ICU availability serving as a tiebreaker. Hospitalization data was available for about 77% of counties in the U.S. Keep reading to see what hospital capacity looks like in your county.
![]()

Canva
#50. Bullock County, AL
– Inpatient beds occupied: 27.0% (0.0% by COVID-19 patients)
— 64.0% more availability than Alabama overall
– ICU beds occupied: data not available
— 86% full in Alabama overall
– Cases per 100k in last 7 days: 69 (7 cases)
– Population that is fully vaccinated: 47.1% (4,756 fully vaccinated)
— 0.4% lower vaccination rate than Alabama
JNix // Shutterstock
#49. Clay County, AL
– Inpatient beds occupied: 30.0% (0.0% by COVID-19 patients)
— 60.0% more availability than Alabama overall
– ICU beds occupied: 75.0% (0.0% by COVID-19 patients)
— 12.8% more availability than Alabama overall
– Cases per 100k in last 7 days: 174 (23 cases)
– Population that is fully vaccinated: 40.6% (5,373 fully vaccinated)
— 14.2% lower vaccination rate than Alabama
Chris Pruitt // Wikimedia Commons
#48. Butler County, AL
– Inpatient beds occupied: 31.0% (3.0% by COVID-19 patients)
— 58.7% more availability than Alabama overall
– ICU beds occupied: 67.0% (14.0% by COVID-19 patients)
— 22.1% more availability than Alabama overall
– Cases per 100k in last 7 days: 77 (15 cases)
– Population that is fully vaccinated: 36.9% (7,173 fully vaccinated)
— 22.0% lower vaccination rate than Alabama
Canva
#47. Winston County, AL
– Inpatient beds occupied: 32.0% (1.0% by COVID-19 patients)
— 57.3% more availability than Alabama overall
– ICU beds occupied: data not available
— 86% full in Alabama overall
– Cases per 100k in last 7 days: 106 (25 cases)
– Population that is fully vaccinated: 20.8% (4,918 fully vaccinated)
— 56.0% lower vaccination rate than Alabama
Carol M. Highsmith // Wikimedia Commons
#46. Hale County, AL
– Inpatient beds occupied: 33.0% (4.0% by COVID-19 patients)
— 56.0% more availability than Alabama overall
– ICU beds occupied: data not available
— 86% full in Alabama overall
– Cases per 100k in last 7 days: 75 (11 cases)
– Population that is fully vaccinated: 57.6% (8,435 fully vaccinated)
— 21.8% higher vaccination rate than Alabama
Canva
#45. Sumter County, AL
– Inpatient beds occupied: 34.0% (1.0% by COVID-19 patients)
— 54.7% more availability than Alabama overall
– ICU beds occupied: data not available
— 86% full in Alabama overall
– Cases per 100k in last 7 days: 32 (4 cases)
– Population that is fully vaccinated: 47.2% (5,867 fully vaccinated)
— 0.2% lower vaccination rate than Alabama
Rivers A. Langley; SaveRivers // Wikimedia Commons
#44. Tallapoosa County, AL
– Inpatient beds occupied: 36.0% (2.0% by COVID-19 patients)
— 52.0% more availability than Alabama overall
– ICU beds occupied: 95.0% (0.0% by COVID-19 patients)
— 10.5% more full than Alabama overall
– Cases per 100k in last 7 days: 233 (94 cases)
– Population that is fully vaccinated: 36.9% (14,904 fully vaccinated)
— 22.0% lower vaccination rate than Alabama
Canva
#43. Escambia County, AL
– Inpatient beds occupied: 37.0% (1.0% by COVID-19 patients)
— 50.7% more availability than Alabama overall
– ICU beds occupied: 43.0% (9.0% by COVID-19 patients)
— 50.0% more availability than Alabama overall
– Cases per 100k in last 7 days: 57 (21 cases)
– Population that is fully vaccinated: 34.2% (12,540 fully vaccinated)
— 27.7% lower vaccination rate than Alabama
Rudi Weikard // Wikimedia Commons
#42. Marion County, AL
– Inpatient beds occupied: 37.0% (0.0% by COVID-19 patients)
— 50.7% more availability than Alabama overall
– ICU beds occupied: 71.0% (4.0% by COVID-19 patients)
— 17.4% more availability than Alabama overall
– Cases per 100k in last 7 days: 71 (21 cases)
– Population that is fully vaccinated: 34.6% (10,280 fully vaccinated)
— 26.8% lower vaccination rate than Alabama
Rudi Weikard // Wikimedia Commons
#41. Blount County, AL
– Inpatient beds occupied: 40.0% (3.0% by COVID-19 patients)
— 46.7% more availability than Alabama overall
– ICU beds occupied: 45.0% (0.0% by COVID-19 patients)
— 47.7% more availability than Alabama overall
– Cases per 100k in last 7 days: 194 (112 cases)
– Population that is fully vaccinated: 29.4% (16,982 fully vaccinated)
— 37.8% lower vaccination rate than Alabama
DXR // Wikimedia Commons
#40. Dallas County, AL
– Inpatient beds occupied: 40.0% (1.0% by COVID-19 patients)
— 46.7% more availability than Alabama overall
– ICU beds occupied: 60.0% (0.0% by COVID-19 patients)
— 30.2% more availability than Alabama overall
– Cases per 100k in last 7 days: 73 (27 cases)
– Population that is fully vaccinated: 42.0% (15,604 fully vaccinated)
— 11.2% lower vaccination rate than Alabama
Canva
#39. Bibb County, AL
– Inpatient beds occupied: 41.0% (0.0% by COVID-19 patients)
— 45.3% more availability than Alabama overall
– ICU beds occupied: data not available
— 86% full in Alabama overall
– Cases per 100k in last 7 days: 94 (21 cases)
– Population that is fully vaccinated: 32.4% (7,262 fully vaccinated)
— 31.5% lower vaccination rate than Alabama
Canva
#38. Greene County, AL
– Inpatient beds occupied: 41.0% (0.0% by COVID-19 patients)
— 45.3% more availability than Alabama overall
– ICU beds occupied: data not available
— 86% full in Alabama overall
– Cases per 100k in last 7 days: 62 (5 cases)
– Population that is fully vaccinated: 47.6% (3,862 fully vaccinated)
— 0.6% higher vaccination rate than Alabama
Springfieldohio // Wikimedia Commons
#37. Jackson County, AL
– Inpatient beds occupied: 43.0% (3.0% by COVID-19 patients)
— 42.7% more availability than Alabama overall
– ICU beds occupied: 53.0% (0.0% by COVID-19 patients)
— 38.4% more availability than Alabama overall
– Cases per 100k in last 7 days: 157 (81 cases)
– Population that is fully vaccinated: 46.0% (23,760 fully vaccinated)
— 2.7% lower vaccination rate than Alabama
Kreeder13 // Wikimedia Commons
#36. Pike County, AL
– Inpatient beds occupied: 47.0% (1.0% by COVID-19 patients)
— 37.3% more availability than Alabama overall
– ICU beds occupied: 48.0% (5.0% by COVID-19 patients)
— 44.2% more availability than Alabama overall
– Cases per 100k in last 7 days: 91 (30 cases)
– Population that is fully vaccinated: 39.2% (12,974 fully vaccinated)
— 17.1% lower vaccination rate than Alabama
Canva
#35. Fayette County, AL
– Inpatient beds occupied: 48.0% (6.0% by COVID-19 patients)
— 36.0% more availability than Alabama overall
– ICU beds occupied: 0.0% (0.0% by COVID-19 patients)
— 100.0% more availability than Alabama overall
– Cases per 100k in last 7 days: 110 (18 cases)
– Population that is fully vaccinated: 32.8% (5,353 fully vaccinated)
— 30.7% lower vaccination rate than Alabama
Chris Pruitt // Wikimedia Commons
#34. Conecuh County, AL
– Inpatient beds occupied: 48.0% (0.0% by COVID-19 patients)
— 36.0% more availability than Alabama overall
– ICU beds occupied: data not available
— 86% full in Alabama overall
– Cases per 100k in last 7 days: 25 (3 cases)
– Population that is fully vaccinated: 40.0% (4,825 fully vaccinated)
— 15.4% lower vaccination rate than Alabama
Michael Rivera // Wikimedia Commons
#33. Dale County, AL
– Inpatient beds occupied: 50.0% (4.0% by COVID-19 patients)
— 33.3% more availability than Alabama overall
– ICU beds occupied: 49.0% (11.0% by COVID-19 patients)
— 43.0% more availability than Alabama overall
– Cases per 100k in last 7 days: 96 (47 cases)
– Population that is fully vaccinated: 50.8% (24,966 fully vaccinated)
— 7.4% higher vaccination rate than Alabama
Wmr36104 // Wikimedia Commons
#32. Geneva County, AL
– Inpatient beds occupied: 50.0% (1.0% by COVID-19 patients)
— 33.3% more availability than Alabama overall
– ICU beds occupied: 69.0% (0.0% by COVID-19 patients)
— 19.8% more availability than Alabama overall
– Cases per 100k in last 7 days: 65 (17 cases)
– Population that is fully vaccinated: 36.3% (9,548 fully vaccinated)
— 23.3% lower vaccination rate than Alabama
Carol M. Highsmith // Wikimedia Commons
#31. Limestone County, AL
– Inpatient beds occupied: 51.0% (4.0% by COVID-19 patients)
— 32.0% more availability than Alabama overall
– ICU beds occupied: 79.0% (27.0% by COVID-19 patients)
— 8.1% more availability than Alabama overall
– Cases per 100k in last 7 days: 116 (115 cases)
– Population that is fully vaccinated: 34.5% (34,095 fully vaccinated)
— 27.1% lower vaccination rate than Alabama
Rivers A. Langley; SaveRivers // Wikimedia Commons
#30. Randolph County, AL
– Inpatient beds occupied: 52.0% (1.0% by COVID-19 patients)
— 30.7% more availability than Alabama overall
– ICU beds occupied: data not available
— 86% full in Alabama overall
– Cases per 100k in last 7 days: 123 (28 cases)
– Population that is fully vaccinated: 31.6% (7,186 fully vaccinated)
— 33.2% lower vaccination rate than Alabama
Rivers Langley; SaveRivers // Wikimedia Commons
#29. Crenshaw County, AL
– Inpatient beds occupied: 55.0% (2.0% by COVID-19 patients)
— 26.7% more availability than Alabama overall
– ICU beds occupied: data not available
— 86% full in Alabama overall
– Cases per 100k in last 7 days: 73 (10 cases)
– Population that is fully vaccinated: 32.2% (4,441 fully vaccinated)
— 31.9% lower vaccination rate than Alabama
Rudi Weikard // Wikimedia Commons
#28. Franklin County, AL
– Inpatient beds occupied: 56.0% (8.0% by COVID-19 patients)
— 25.3% more availability than Alabama overall
– ICU beds occupied: 36.0% (2.0% by COVID-19 patients)
— 58.1% more availability than Alabama overall
– Cases per 100k in last 7 days: 121 (38 cases)
– Population that is fully vaccinated: 41.1% (12,899 fully vaccinated)
— 13.1% lower vaccination rate than Alabama
Canva
#27. Marengo County, AL
– Inpatient beds occupied: 56.0% (2.0% by COVID-19 patients)
— 25.3% more availability than Alabama overall
– ICU beds occupied: 83.0% (23.0% by COVID-19 patients)
— 3.5% more availability than Alabama overall
– Cases per 100k in last 7 days: 53 (10 cases)
– Population that is fully vaccinated: 51.3% (9,672 fully vaccinated)
— 8.5% higher vaccination rate than Alabama
Rivers Langley; SaveRivers // Wikimedia Commons
#26. Chambers County, AL
– Inpatient beds occupied: 56.0% (1.0% by COVID-19 patients)
— 25.3% more availability than Alabama overall
– ICU beds occupied: data not available
— 86% full in Alabama overall
– Cases per 100k in last 7 days: 102 (34 cases)
– Population that is fully vaccinated: 29.3% (9,745 fully vaccinated)
— 38.1% lower vaccination rate than Alabama
Dailynetworks // Wikimedia Commons
#25. Colbert County, AL
– Inpatient beds occupied: 58.0% (5.0% by COVID-19 patients)
— 22.7% more availability than Alabama overall
– ICU beds occupied: 49.0% (25.0% by COVID-19 patients)
— 43.0% more availability than Alabama overall
– Cases per 100k in last 7 days: 83 (46 cases)
– Population that is fully vaccinated: 45.4% (25,098 fully vaccinated)
— 4.0% lower vaccination rate than Alabama
Rivers Langley; SaveRivers // Wikimedia Commons
#24. Barbour County, AL
– Inpatient beds occupied: 62.0% (1.0% by COVID-19 patients)
— 17.3% more availability than Alabama overall
– ICU beds occupied: 66.0% (0.0% by COVID-19 patients)
— 23.3% more availability than Alabama overall
– Cases per 100k in last 7 days: 28 (7 cases)
– Population that is fully vaccinated: 41.6% (10,278 fully vaccinated)
— 12.1% lower vaccination rate than Alabama
Canva
#23. Walker County, AL
– Inpatient beds occupied: 62.0% (7.0% by COVID-19 patients)
— 17.3% more availability than Alabama overall
– ICU beds occupied: 81.0% (10.0% by COVID-19 patients)
— 5.8% more availability than Alabama overall
– Cases per 100k in last 7 days: 167 (106 cases)
– Population that is fully vaccinated: 44.7% (28,378 fully vaccinated)
— 5.5% lower vaccination rate than Alabama
Canva
#22. Marshall County, AL
– Inpatient beds occupied: 64.0% (8.0% by COVID-19 patients)
— 14.7% more availability than Alabama overall
– ICU beds occupied: 75.0% (21.0% by COVID-19 patients)
— 12.8% more availability than Alabama overall
– Cases per 100k in last 7 days: 152 (147 cases)
– Population that is fully vaccinated: 42.7% (41,283 fully vaccinated)
— 9.7% lower vaccination rate than Alabama
Canva
#21. DeKalb County, AL
– Inpatient beds occupied: 64.0% (8.0% by COVID-19 patients)
— 14.7% more availability than Alabama overall
– ICU beds occupied: 75.0% (33.0% by COVID-19 patients)
— 12.8% more availability than Alabama overall
– Cases per 100k in last 7 days: 119 (85 cases)
– Population that is fully vaccinated: 31.8% (22,724 fully vaccinated)
— 32.8% lower vaccination rate than Alabama
Chris Pruitt // Wikimedia Commons
#20. Covington County, AL
– Inpatient beds occupied: 64.0% (1.0% by COVID-19 patients)
— 14.7% more availability than Alabama overall
– ICU beds occupied: 77.0% (4.0% by COVID-19 patients)
— 10.5% more availability than Alabama overall
– Cases per 100k in last 7 days: 65 (24 cases)
– Population that is fully vaccinated: 36.0% (13,347 fully vaccinated)
— 23.9% lower vaccination rate than Alabama
Tracy Burroughs Brown // Shutterstock
#19. Tuscaloosa County, AL
– Inpatient beds occupied: 64.0% (2.0% by COVID-19 patients)
— 14.7% more availability than Alabama overall
– ICU beds occupied: 97.0% (4.0% by COVID-19 patients)
— 12.8% more full than Alabama overall
– Cases per 100k in last 7 days: 71 (149 cases)
– Population that is fully vaccinated: 41.0% (85,899 fully vaccinated)
— 13.3% lower vaccination rate than Alabama
Rivers Langley; SaveRivers // Wikimedia Commons
#18. Shelby County, AL
– Inpatient beds occupied: 67.0% (4.0% by COVID-19 patients)
— 10.7% more availability than Alabama overall
– ICU beds occupied: 56.0% (7.0% by COVID-19 patients)
— 34.9% more availability than Alabama overall
– Cases per 100k in last 7 days: 146 (318 cases)
– Population that is fully vaccinated: 33.8% (73,674 fully vaccinated)
— 28.5% lower vaccination rate than Alabama
Rivers Langley; SaveRivers // Wikimedia Commons
#17. Talladega County, AL
– Inpatient beds occupied: 67.0% (2.0% by COVID-19 patients)
— 10.7% more availability than Alabama overall
– ICU beds occupied: 62.0% (6.0% by COVID-19 patients)
— 27.9% more availability than Alabama overall
– Cases per 100k in last 7 days: 120 (96 cases)
– Population that is fully vaccinated: 34.6% (27,677 fully vaccinated)
— 26.8% lower vaccination rate than Alabama
Rudi Weikard // Wikimedia Commons
#16. St. Clair County, AL
– Inpatient beds occupied: 69.0% (5.0% by COVID-19 patients)
— 8.0% more availability than Alabama overall
– ICU beds occupied: 67.0% (24.0% by COVID-19 patients)
— 22.1% more availability than Alabama overall
– Cases per 100k in last 7 days: 142 (127 cases)
– Population that is fully vaccinated: 36.8% (32,918 fully vaccinated)
— 22.2% lower vaccination rate than Alabama
MPearsallArt // Wikimedia Commons
#15. Morgan County, AL
– Inpatient beds occupied: 69.0% (6.0% by COVID-19 patients)
— 8.0% more availability than Alabama overall
– ICU beds occupied: 78.0% (32.0% by COVID-19 patients)
— 9.3% more availability than Alabama overall
– Cases per 100k in last 7 days: 145 (173 cases)
– Population that is fully vaccinated: 41.1% (49,142 fully vaccinated)
— 13.1% lower vaccination rate than Alabama
Prestinian // Wikimedia Commons
#14. Etowah County, AL
– Inpatient beds occupied: 71.0% (2.0% by COVID-19 patients)
— 5.3% more availability than Alabama overall
– ICU beds occupied: 98.0% (8.0% by COVID-19 patients)
— 14.0% more full than Alabama overall
– Cases per 100k in last 7 days: 69 (71 cases)
– Population that is fully vaccinated: 38.8% (39,699 fully vaccinated)
— 18.0% lower vaccination rate than Alabama
Calvin Beale // Wikimedia Commons
#13. Coffee County, AL
– Inpatient beds occupied: 73.0% (2.0% by COVID-19 patients)
— 2.7% more availability than Alabama overall
– ICU beds occupied: 68.0% (6.0% by COVID-19 patients)
— 20.9% more availability than Alabama overall
– Cases per 100k in last 7 days: 65 (34 cases)
– Population that is fully vaccinated: 37.5% (19,607 fully vaccinated)
— 20.7% lower vaccination rate than Alabama
Rivers Langley SaveRivers // Wikimedia Commons
#12. Russell County, AL
– Inpatient beds occupied: 75.0% (3.0% by COVID-19 patients)
— 0.0% more availability than Alabama overall
– ICU beds occupied: 68.0% (9.0% by COVID-19 patients)
— 20.9% more availability than Alabama overall
– Cases per 100k in last 7 days: 74 (43 cases)
– Population that is fully vaccinated: 37.3% (21,634 fully vaccinated)
— 21.1% lower vaccination rate than Alabama
Chris Pruitt // Wikimedia Commons
#11. Cullman County, AL
– Inpatient beds occupied: 76.0% (8.0% by COVID-19 patients)
— 1.3% more full than Alabama overall
– ICU beds occupied: 82.0% (14.0% by COVID-19 patients)
— 4.7% more availability than Alabama overall
– Cases per 100k in last 7 days: 196 (164 cases)
– Population that is fully vaccinated: 36.2% (30,355 fully vaccinated)
— 23.5% lower vaccination rate than Alabama
Chris Pruitt // wikicommons
#10. Montgomery County, AL
– Inpatient beds occupied: 76.0% (3.0% by COVID-19 patients)
— 1.3% more full than Alabama overall
– ICU beds occupied: 97.0% (9.0% by COVID-19 patients)
— 12.8% more full than Alabama overall
– Cases per 100k in last 7 days: 121 (274 cases)
– Population that is fully vaccinated: 49.6% (112,282 fully vaccinated)
— 4.9% higher vaccination rate than Alabama
Library of Congress
#9. Lee County, AL
– Inpatient beds occupied: 80.0% (3.0% by COVID-19 patients)
— 6.7% more full than Alabama overall
– ICU beds occupied: 77.0% (10.0% by COVID-19 patients)
— 10.5% more availability than Alabama overall
– Cases per 100k in last 7 days: 88 (144 cases)
– Population that is fully vaccinated: 36.3% (59,704 fully vaccinated)
— 23.3% lower vaccination rate than Alabama
Jodybwiki // Wikimedia Commons
#8. Baldwin County, AL
– Inpatient beds occupied: 80.0% (2.0% by COVID-19 patients)
— 6.7% more full than Alabama overall
– ICU beds occupied: 92.0% (8.0% by COVID-19 patients)
— 7.0% more full than Alabama overall
– Cases per 100k in last 7 days: 77 (171 cases)
– Population that is fully vaccinated: 47.2% (105,354 fully vaccinated)
— 0.2% lower vaccination rate than Alabama
Chris Pruitt // Wikimedia Commons
#7. Autauga County, AL
– Inpatient beds occupied: 80.0% (5.0% by COVID-19 patients)
— 6.7% more full than Alabama overall
– ICU beds occupied: 104.0% (17.0% by COVID-19 patients)
— 20.9% more full than Alabama overall
– Cases per 100k in last 7 days: 98 (55 cases)
– Population that is fully vaccinated: 38.1% (21,269 fully vaccinated)
— 19.5% lower vaccination rate than Alabama
M Floyd // Flickr
#6. Jefferson County, AL
– Inpatient beds occupied: 82.0% (2.0% by COVID-19 patients)
— 9.3% more full than Alabama overall
– ICU beds occupied: 91.0% (7.0% by COVID-19 patients)
— 5.8% more full than Alabama overall
– Cases per 100k in last 7 days: 137 (900 cases)
– Population that is fully vaccinated: 53.9% (354,889 fully vaccinated)
— 14.0% higher vaccination rate than Alabama
Rivers Langley; SaveRivers // Wikimedia Commons
#5. Calhoun County, AL
– Inpatient beds occupied: 82.0% (1.0% by COVID-19 patients)
— 9.3% more full than Alabama overall
– ICU beds occupied: 100.0% (0.0% by COVID-19 patients)
— 16.3% more full than Alabama overall
– Cases per 100k in last 7 days: 91 (103 cases)
– Population that is fully vaccinated: 44.5% (50,583 fully vaccinated)
— 5.9% lower vaccination rate than Alabama
Altairisfar // Wikicommons
#4. Mobile County, AL
– Inpatient beds occupied: 84.0% (2.0% by COVID-19 patients)
— 12.0% more full than Alabama overall
– ICU beds occupied: 87.0% (3.0% by COVID-19 patients)
— 1.2% more full than Alabama overall
– Cases per 100k in last 7 days: 73 (303 cases)
– Population that is fully vaccinated: 46.3% (191,115 fully vaccinated)
— 2.1% lower vaccination rate than Alabama
Wayne James // Shutterstock
#3. Lauderdale County, AL
– Inpatient beds occupied: 89.0% (6.0% by COVID-19 patients)
— 18.7% more full than Alabama overall
– ICU beds occupied: 77.0% (18.0% by COVID-19 patients)
— 10.5% more availability than Alabama overall
– Cases per 100k in last 7 days: 82 (76 cases)
– Population that is fully vaccinated: 43.6% (40,412 fully vaccinated)
— 7.8% lower vaccination rate than Alabama
Pixabay
#2. Madison County, AL
– Inpatient beds occupied: 90.0% (3.0% by COVID-19 patients)
— 20.0% more full than Alabama overall
– ICU beds occupied: 93.0% (10.0% by COVID-19 patients)
— 8.1% more full than Alabama overall
– Cases per 100k in last 7 days: 140 (523 cases)
– Population that is fully vaccinated: 57.0% (212,649 fully vaccinated)
— 20.5% higher vaccination rate than Alabama
Carol M. Highsmith/Library of Congress // Wikimedia Commons
#1. Houston County, AL
– Inpatient beds occupied: 94.0% (4.0% by COVID-19 patients)
— 25.3% more full than Alabama overall
– ICU beds occupied: 100.0% (11.0% by COVID-19 patients)
— 16.3% more full than Alabama overall
– Cases per 100k in last 7 days: 109 (115 cases)
– Population that is fully vaccinated: 40.5% (42,906 fully vaccinated)
— 14.4% lower vaccination rate than Alabama