Counties with the lowest hospital bed capacity in Alabama
Published 1:58 pm Saturday, November 20, 2021
Wayne James // Shutterstock
Counties with the lowest hospital bed capacity in Alabama
The deployment of vaccines beginning in December signaled a turning point in the pandemic. By Feb. 2,more Americans had been vaccinated for COVID-19 than had been infected. But as vaccination rates lagged over the summer, new surges of COVID-19 came. More than 80% of these cases by late July were caused by the Delta variant, which is more contagious than the original virus. This has resulted in growing rates of community transmission and—especially in areas with lower vaccination rates—increasing rates of hospitalization and death.
The United States reached 767,692 COVID-19-related deaths and 47.4 million COVID-19 cases as of Nov. 18, according to Johns Hopkins University.
Currently, 58.9% of the U.S. population is fully vaccinated. Epidemiologists say the lower the vaccination rate, the more the virus has the opportunity to continue to evolve and become more dangerous.
Stacker compiled a list of the counties with the lowest in-patient bed capacity in Alabama using data from the U.S. Department of Health & Human Services. Counties are ranked by the percent of in-patient hospital beds filled as of Nov. 17, with ICU availability serving as a tiebreaker. Hospitalization data was available for about 77% of counties in the U.S. Keep reading to see what hospital capacity looks like in your county.
![]()

Canva
#50. Winston County, AL
– Inpatient beds occupied: 29.0% (1.0% by COVID-19 patients)
— 60.8% more availability than Alabama overall
– ICU beds occupied: data not available
— 85% full in Alabama overall
– Cases per 100k in last 7 days: 47 (11 cases)
– Population that is fully vaccinated: 20.1% (4,747 fully vaccinated)
— 55.9% lower vaccination rate than Alabama
Canva
#49. Bibb County, AL
– Inpatient beds occupied: 30.0% (0.0% by COVID-19 patients)
— 59.5% more availability than Alabama overall
– ICU beds occupied: data not available
— 85% full in Alabama overall
– Cases per 100k in last 7 days: 98 (22 cases)
– Population that is fully vaccinated: 31.5% (7,065 fully vaccinated)
— 30.9% lower vaccination rate than Alabama
Rivers A. Langley; SaveRivers // Wikimedia Commons
#48. Tallapoosa County, AL
– Inpatient beds occupied: 31.0% (1.0% by COVID-19 patients)
— 58.1% more availability than Alabama overall
– ICU beds occupied: 73.0% (0.0% by COVID-19 patients)
— 14.1% more availability than Alabama overall
– Cases per 100k in last 7 days: 84 (34 cases)
– Population that is fully vaccinated: 35.5% (14,317 fully vaccinated)
— 22.1% lower vaccination rate than Alabama
Carol M. Highsmith // Wikimedia Commons
#47. Monroe County, AL
– Inpatient beds occupied: 32.0% (2.0% by COVID-19 patients)
— 56.8% more availability than Alabama overall
– ICU beds occupied: 59.0% (0.0% by COVID-19 patients)
— 30.6% more availability than Alabama overall
– Cases per 100k in last 7 days: 39 (8 cases)
– Population that is fully vaccinated: 39.9% (8,266 fully vaccinated)
— 12.5% lower vaccination rate than Alabama
Canva
#46. Bullock County, AL
– Inpatient beds occupied: 32.0% (0.0% by COVID-19 patients)
— 56.8% more availability than Alabama overall
– ICU beds occupied: data not available
— 85% full in Alabama overall
– Cases per 100k in last 7 days: 50 (5 cases)
– Population that is fully vaccinated: 45.5% (4,601 fully vaccinated)
— 0.2% lower vaccination rate than Alabama
Canva
#45. Fayette County, AL
– Inpatient beds occupied: 33.0% (0.0% by COVID-19 patients)
— 55.4% more availability than Alabama overall
– ICU beds occupied: 0.0% (0.0% by COVID-19 patients)
— 100.0% more availability than Alabama overall
– Cases per 100k in last 7 days: 497 (81 cases)
– Population that is fully vaccinated: 31.7% (5,161 fully vaccinated)
— 30.5% lower vaccination rate than Alabama
Rudi Weikard // Wikimedia Commons
#44. Cherokee County, AL
– Inpatient beds occupied: 33.0% (2.0% by COVID-19 patients)
— 55.4% more availability than Alabama overall
– ICU beds occupied: data not available
— 85% full in Alabama overall
– Cases per 100k in last 7 days: 88 (23 cases)
– Population that is fully vaccinated: 29.2% (7,655 fully vaccinated)
— 36.0% lower vaccination rate than Alabama
Canva
#43. Sumter County, AL
– Inpatient beds occupied: 33.0% (0.0% by COVID-19 patients)
— 55.4% more availability than Alabama overall
– ICU beds occupied: data not available
— 85% full in Alabama overall
– Cases per 100k in last 7 days: 56 (7 cases)
– Population that is fully vaccinated: 45.3% (5,626 fully vaccinated)
— 0.7% lower vaccination rate than Alabama
Rudi Weikard // Wikimedia Commons
#42. Marion County, AL
– Inpatient beds occupied: 35.0% (3.0% by COVID-19 patients)
— 52.7% more availability than Alabama overall
– ICU beds occupied: 14.0% (0.0% by COVID-19 patients)
— 83.5% more availability than Alabama overall
– Cases per 100k in last 7 days: 81 (24 cases)
– Population that is fully vaccinated: 33.5% (9,944 fully vaccinated)
— 26.5% lower vaccination rate than Alabama
JNix // Shutterstock
#41. Clay County, AL
– Inpatient beds occupied: 35.0% (0.0% by COVID-19 patients)
— 52.7% more availability than Alabama overall
– ICU beds occupied: 18.0% (0.0% by COVID-19 patients)
— 78.8% more availability than Alabama overall
– Cases per 100k in last 7 days: 98 (13 cases)
– Population that is fully vaccinated: 38.8% (5,141 fully vaccinated)
— 14.9% lower vaccination rate than Alabama
Canva
#40. Greene County, AL
– Inpatient beds occupied: 37.0% (0.0% by COVID-19 patients)
— 50.0% more availability than Alabama overall
– ICU beds occupied: data not available
— 85% full in Alabama overall
– Cases per 100k in last 7 days: 111 (9 cases)
– Population that is fully vaccinated: 45.9% (3,723 fully vaccinated)
— 0.7% higher vaccination rate than Alabama
Springfieldohio // Wikimedia Commons
#39. Jackson County, AL
– Inpatient beds occupied: 40.0% (4.0% by COVID-19 patients)
— 45.9% more availability than Alabama overall
– ICU beds occupied: 56.0% (0.0% by COVID-19 patients)
— 34.1% more availability than Alabama overall
– Cases per 100k in last 7 days: 41 (21 cases)
– Population that is fully vaccinated: 44.4% (22,911 fully vaccinated)
— 2.6% lower vaccination rate than Alabama
Rudi Weikard // Wikimedia Commons
#38. Blount County, AL
– Inpatient beds occupied: 41.0% (0.0% by COVID-19 patients)
— 44.6% more availability than Alabama overall
– ICU beds occupied: 40.0% (0.0% by COVID-19 patients)
— 52.9% more availability than Alabama overall
– Cases per 100k in last 7 days: 93 (54 cases)
– Population that is fully vaccinated: 28.5% (16,476 fully vaccinated)
— 37.5% lower vaccination rate than Alabama
Canva
#37. Escambia County, AL
– Inpatient beds occupied: 42.0% (2.0% by COVID-19 patients)
— 43.2% more availability than Alabama overall
– ICU beds occupied: 36.0% (9.0% by COVID-19 patients)
— 57.6% more availability than Alabama overall
– Cases per 100k in last 7 days: 68 (25 cases)
– Population that is fully vaccinated: 33.0% (12,085 fully vaccinated)
— 27.6% lower vaccination rate than Alabama
Rudi Weikard // Wikimedia Commons
#36. Franklin County, AL
– Inpatient beds occupied: 45.0% (4.0% by COVID-19 patients)
— 39.2% more availability than Alabama overall
– ICU beds occupied: 45.0% (14.0% by COVID-19 patients)
— 47.1% more availability than Alabama overall
– Cases per 100k in last 7 days: 169 (53 cases)
– Population that is fully vaccinated: 40.0% (12,530 fully vaccinated)
— 12.3% lower vaccination rate than Alabama
Carol M. Highsmith // Wikimedia Commons
#35. Hale County, AL
– Inpatient beds occupied: 46.0% (9.0% by COVID-19 patients)
— 37.8% more availability than Alabama overall
– ICU beds occupied: data not available
— 85% full in Alabama overall
– Cases per 100k in last 7 days: 55 (8 cases)
– Population that is fully vaccinated: 55.3% (8,097 fully vaccinated)
— 21.3% higher vaccination rate than Alabama
Kreeder13 // Wikimedia Commons
#34. Pike County, AL
– Inpatient beds occupied: 49.0% (2.0% by COVID-19 patients)
— 33.8% more availability than Alabama overall
– ICU beds occupied: 69.0% (3.0% by COVID-19 patients)
— 18.8% more availability than Alabama overall
– Cases per 100k in last 7 days: 21 (7 cases)
– Population that is fully vaccinated: 37.9% (12,558 fully vaccinated)
— 16.9% lower vaccination rate than Alabama
DXR // Wikimedia Commons
#33. Dallas County, AL
– Inpatient beds occupied: 50.0% (1.0% by COVID-19 patients)
— 32.4% more availability than Alabama overall
– ICU beds occupied: 83.0% (13.0% by COVID-19 patients)
— 2.4% more availability than Alabama overall
– Cases per 100k in last 7 days: 51 (19 cases)
– Population that is fully vaccinated: 39.9% (14,857 fully vaccinated)
— 12.5% lower vaccination rate than Alabama
Chris Pruitt // Wikimedia Commons
#32. Conecuh County, AL
– Inpatient beds occupied: 50.0% (1.0% by COVID-19 patients)
— 32.4% more availability than Alabama overall
– ICU beds occupied: data not available
— 85% full in Alabama overall
– Cases per 100k in last 7 days: 83 (10 cases)
– Population that is fully vaccinated: 38.6% (4,654 fully vaccinated)
— 15.4% lower vaccination rate than Alabama
Rivers Langley; SaveRivers // Wikimedia Commons
#31. Barbour County, AL
– Inpatient beds occupied: 52.0% (0.0% by COVID-19 patients)
— 29.7% more availability than Alabama overall
– ICU beds occupied: 37.0% (0.0% by COVID-19 patients)
— 56.5% more availability than Alabama overall
– Cases per 100k in last 7 days: 134 (33 cases)
– Population that is fully vaccinated: 39.2% (9,678 fully vaccinated)
— 14.0% lower vaccination rate than Alabama
Carol M. Highsmith // Wikimedia Commons
#30. Limestone County, AL
– Inpatient beds occupied: 53.0% (3.0% by COVID-19 patients)
— 28.4% more availability than Alabama overall
– ICU beds occupied: 63.0% (10.0% by COVID-19 patients)
— 25.9% more availability than Alabama overall
– Cases per 100k in last 7 days: 118 (117 cases)
– Population that is fully vaccinated: 33.5% (33,157 fully vaccinated)
— 26.5% lower vaccination rate than Alabama
Dailynetworks // Wikimedia Commons
#29. Colbert County, AL
– Inpatient beds occupied: 54.0% (2.0% by COVID-19 patients)
— 27.0% more availability than Alabama overall
– ICU beds occupied: 69.0% (25.0% by COVID-19 patients)
— 18.8% more availability than Alabama overall
– Cases per 100k in last 7 days: 80 (44 cases)
– Population that is fully vaccinated: 44.1% (24,387 fully vaccinated)
— 3.3% lower vaccination rate than Alabama
Chris Pruitt // Wikimedia Commons
#28. Covington County, AL
– Inpatient beds occupied: 57.0% (1.0% by COVID-19 patients)
— 23.0% more availability than Alabama overall
– ICU beds occupied: 65.0% (5.0% by COVID-19 patients)
— 23.5% more availability than Alabama overall
– Cases per 100k in last 7 days: 200 (74 cases)
– Population that is fully vaccinated: 34.9% (12,945 fully vaccinated)
— 23.5% lower vaccination rate than Alabama
Michael Rivera // Wikimedia Commons
#27. Dale County, AL
– Inpatient beds occupied: 59.0% (2.0% by COVID-19 patients)
— 20.3% more availability than Alabama overall
– ICU beds occupied: 69.0% (17.0% by COVID-19 patients)
— 18.8% more availability than Alabama overall
– Cases per 100k in last 7 days: 55 (27 cases)
– Population that is fully vaccinated: 48.6% (23,905 fully vaccinated)
— 6.6% higher vaccination rate than Alabama
Chris Pruitt // Wikimedia Commons
#26. Autauga County, AL
– Inpatient beds occupied: 59.0% (4.0% by COVID-19 patients)
— 20.3% more availability than Alabama overall
– ICU beds occupied: 86.0% (5.0% by COVID-19 patients)
— 1.2% more full than Alabama overall
– Cases per 100k in last 7 days: 124 (69 cases)
– Population that is fully vaccinated: 36.4% (20,334 fully vaccinated)
— 20.2% lower vaccination rate than Alabama
Wmr36104 // Wikimedia Commons
#25. Geneva County, AL
– Inpatient beds occupied: 60.0% (1.0% by COVID-19 patients)
— 18.9% more availability than Alabama overall
– ICU beds occupied: 62.0% (0.0% by COVID-19 patients)
— 27.1% more availability than Alabama overall
– Cases per 100k in last 7 days: 53 (14 cases)
– Population that is fully vaccinated: 35.0% (9,193 fully vaccinated)
— 23.2% lower vaccination rate than Alabama
Tracy Burroughs Brown // Shutterstock
#24. Tuscaloosa County, AL
– Inpatient beds occupied: 61.0% (2.0% by COVID-19 patients)
— 17.6% more availability than Alabama overall
– ICU beds occupied: 89.0% (4.0% by COVID-19 patients)
— 4.7% more full than Alabama overall
– Cases per 100k in last 7 days: 93 (195 cases)
– Population that is fully vaccinated: 39.4% (82,590 fully vaccinated)
— 13.6% lower vaccination rate than Alabama
Canva
#23. DeKalb County, AL
– Inpatient beds occupied: 61.0% (2.0% by COVID-19 patients)
— 17.6% more availability than Alabama overall
– ICU beds occupied: 90.0% (5.0% by COVID-19 patients)
— 5.9% more full than Alabama overall
– Cases per 100k in last 7 days: 78 (56 cases)
– Population that is fully vaccinated: 30.6% (21,896 fully vaccinated)
— 32.9% lower vaccination rate than Alabama
Rivers Langley; SaveRivers // Wikimedia Commons
#22. Crenshaw County, AL
– Inpatient beds occupied: 62.0% (0.0% by COVID-19 patients)
— 16.2% more availability than Alabama overall
– ICU beds occupied: data not available
— 85% full in Alabama overall
– Cases per 100k in last 7 days: 152 (21 cases)
– Population that is fully vaccinated: 31.3% (4,307 fully vaccinated)
— 31.4% lower vaccination rate than Alabama
Canva
#21. Marshall County, AL
– Inpatient beds occupied: 63.0% (3.0% by COVID-19 patients)
— 14.9% more availability than Alabama overall
– ICU beds occupied: 73.0% (15.0% by COVID-19 patients)
— 14.1% more availability than Alabama overall
– Cases per 100k in last 7 days: 72 (70 cases)
– Population that is fully vaccinated: 41.1% (39,801 fully vaccinated)
— 9.9% lower vaccination rate than Alabama
Rivers Langley; SaveRivers // Wikimedia Commons
#20. Chambers County, AL
– Inpatient beds occupied: 63.0% (0.0% by COVID-19 patients)
— 14.9% more availability than Alabama overall
– ICU beds occupied: data not available
— 85% full in Alabama overall
– Cases per 100k in last 7 days: 48 (16 cases)
– Population that is fully vaccinated: 28.5% (9,487 fully vaccinated)
— 37.5% lower vaccination rate than Alabama
Rivers Langley; SaveRivers // Wikimedia Commons
#19. Talladega County, AL
– Inpatient beds occupied: 66.0% (4.0% by COVID-19 patients)
— 10.8% more availability than Alabama overall
– ICU beds occupied: 52.0% (15.0% by COVID-19 patients)
— 38.8% more availability than Alabama overall
– Cases per 100k in last 7 days: 34 (27 cases)
– Population that is fully vaccinated: 33.5% (26,788 fully vaccinated)
— 26.5% lower vaccination rate than Alabama
Calvin Beale // Wikimedia Commons
#18. Coffee County, AL
– Inpatient beds occupied: 67.0% (2.0% by COVID-19 patients)
— 9.5% more availability than Alabama overall
– ICU beds occupied: 67.0% (8.0% by COVID-19 patients)
— 21.2% more availability than Alabama overall
– Cases per 100k in last 7 days: 44 (23 cases)
– Population that is fully vaccinated: 35.8% (18,751 fully vaccinated)
— 21.5% lower vaccination rate than Alabama
Rivers Langley; SaveRivers // Wikimedia Commons
#17. Shelby County, AL
– Inpatient beds occupied: 67.0% (3.0% by COVID-19 patients)
— 9.5% more availability than Alabama overall
– ICU beds occupied: 68.0% (12.0% by COVID-19 patients)
— 20.0% more availability than Alabama overall
– Cases per 100k in last 7 days: 35 (77 cases)
– Population that is fully vaccinated: 32.8% (71,325 fully vaccinated)
— 28.1% lower vaccination rate than Alabama
Canva
#16. Walker County, AL
– Inpatient beds occupied: 67.0% (3.0% by COVID-19 patients)
— 9.5% more availability than Alabama overall
– ICU beds occupied: 82.0% (12.0% by COVID-19 patients)
— 3.5% more availability than Alabama overall
– Cases per 100k in last 7 days: 178 (113 cases)
– Population that is fully vaccinated: 43.1% (27,367 fully vaccinated)
— 5.5% lower vaccination rate than Alabama
Canva
#15. Marengo County, AL
– Inpatient beds occupied: 69.0% (0.0% by COVID-19 patients)
— 6.8% more availability than Alabama overall
– ICU beds occupied: 75.0% (4.0% by COVID-19 patients)
— 11.8% more availability than Alabama overall
– Cases per 100k in last 7 days: 74 (14 cases)
– Population that is fully vaccinated: 50.2% (9,461 fully vaccinated)
— 10.1% higher vaccination rate than Alabama
Chris Pruitt // Wikimedia Commons
#14. Cullman County, AL
– Inpatient beds occupied: 73.0% (6.0% by COVID-19 patients)
— 1.4% more availability than Alabama overall
– ICU beds occupied: 100.0% (32.0% by COVID-19 patients)
— 17.6% more full than Alabama overall
– Cases per 100k in last 7 days: 101 (85 cases)
– Population that is fully vaccinated: 35.4% (29,651 fully vaccinated)
— 22.4% lower vaccination rate than Alabama
Prestinian // Wikimedia Commons
#13. Etowah County, AL
– Inpatient beds occupied: 74.0% (2.0% by COVID-19 patients)
— 0.0% more availability than Alabama overall
– ICU beds occupied: 90.0% (5.0% by COVID-19 patients)
— 5.9% more full than Alabama overall
– Cases per 100k in last 7 days: 26 (27 cases)
– Population that is fully vaccinated: 37.5% (38,317 fully vaccinated)
— 17.8% lower vaccination rate than Alabama
Chris Pruitt // wikicommons
#12. Montgomery County, AL
– Inpatient beds occupied: 76.0% (2.0% by COVID-19 patients)
— 2.7% more full than Alabama overall
– ICU beds occupied: 96.0% (7.0% by COVID-19 patients)
— 12.9% more full than Alabama overall
– Cases per 100k in last 7 days: 44 (100 cases)
– Population that is fully vaccinated: 47.4% (107,250 fully vaccinated)
— 3.9% higher vaccination rate than Alabama
Rivers Langley SaveRivers // Wikimedia Commons
#11. Russell County, AL
– Inpatient beds occupied: 77.0% (0.0% by COVID-19 patients)
— 4.1% more full than Alabama overall
– ICU beds occupied: 80.0% (0.0% by COVID-19 patients)
— 5.9% more availability than Alabama overall
– Cases per 100k in last 7 days: 48 (28 cases)
– Population that is fully vaccinated: 35.1% (20,349 fully vaccinated)
— 23.0% lower vaccination rate than Alabama
Jodybwiki // Wikimedia Commons
#10. Baldwin County, AL
– Inpatient beds occupied: 77.0% (1.0% by COVID-19 patients)
— 4.1% more full than Alabama overall
– ICU beds occupied: 88.0% (4.0% by COVID-19 patients)
— 3.5% more full than Alabama overall
– Cases per 100k in last 7 days: 69 (154 cases)
– Population that is fully vaccinated: 45.3% (101,162 fully vaccinated)
— 0.7% lower vaccination rate than Alabama
MPearsallArt // Wikimedia Commons
#9. Morgan County, AL
– Inpatient beds occupied: 78.0% (8.0% by COVID-19 patients)
— 5.4% more full than Alabama overall
– ICU beds occupied: 86.0% (34.0% by COVID-19 patients)
— 1.2% more full than Alabama overall
– Cases per 100k in last 7 days: 145 (174 cases)
– Population that is fully vaccinated: 39.6% (47,426 fully vaccinated)
— 13.2% lower vaccination rate than Alabama
Rudi Weikard // Wikimedia Commons
#8. St. Clair County, AL
– Inpatient beds occupied: 78.0% (4.0% by COVID-19 patients)
— 5.4% more full than Alabama overall
– ICU beds occupied: 93.0% (5.0% by COVID-19 patients)
— 9.4% more full than Alabama overall
– Cases per 100k in last 7 days: 57 (51 cases)
– Population that is fully vaccinated: 35.8% (32,022 fully vaccinated)
— 21.5% lower vaccination rate than Alabama
Altairisfar // Wikicommons
#7. Mobile County, AL
– Inpatient beds occupied: 79.0% (1.0% by COVID-19 patients)
— 6.8% more full than Alabama overall
– ICU beds occupied: 78.0% (3.0% by COVID-19 patients)
— 8.2% more availability than Alabama overall
– Cases per 100k in last 7 days: 56 (232 cases)
– Population that is fully vaccinated: 44.4% (183,305 fully vaccinated)
— 2.6% lower vaccination rate than Alabama
Rivers Langley; SaveRivers // Wikimedia Commons
#6. Calhoun County, AL
– Inpatient beds occupied: 80.0% (2.0% by COVID-19 patients)
— 8.1% more full than Alabama overall
– ICU beds occupied: 94.0% (1.0% by COVID-19 patients)
— 10.6% more full than Alabama overall
– Cases per 100k in last 7 days: 124 (141 cases)
– Population that is fully vaccinated: 42.6% (48,369 fully vaccinated)
— 6.6% lower vaccination rate than Alabama
Library of Congress
#5. Lee County, AL
– Inpatient beds occupied: 82.0% (4.0% by COVID-19 patients)
— 10.8% more full than Alabama overall
– ICU beds occupied: 73.0% (8.0% by COVID-19 patients)
— 14.1% more availability than Alabama overall
– Cases per 100k in last 7 days: 38 (63 cases)
– Population that is fully vaccinated: 35.1% (57,711 fully vaccinated)
— 23.0% lower vaccination rate than Alabama
M Floyd // Flickr
#4. Jefferson County, AL
– Inpatient beds occupied: 83.0% (2.0% by COVID-19 patients)
— 12.2% more full than Alabama overall
– ICU beds occupied: 90.0% (6.0% by COVID-19 patients)
— 5.9% more full than Alabama overall
– Cases per 100k in last 7 days: 25 (163 cases)
– Population that is fully vaccinated: 52.1% (342,812 fully vaccinated)
— 14.3% higher vaccination rate than Alabama
Pixabay
#3. Madison County, AL
– Inpatient beds occupied: 87.0% (3.0% by COVID-19 patients)
— 17.6% more full than Alabama overall
– ICU beds occupied: 95.0% (8.0% by COVID-19 patients)
— 11.8% more full than Alabama overall
– Cases per 100k in last 7 days: 45 (169 cases)
– Population that is fully vaccinated: 54.7% (203,804 fully vaccinated)
— 20.0% higher vaccination rate than Alabama
Carol M. Highsmith/Library of Congress // Wikimedia Commons
#2. Houston County, AL
– Inpatient beds occupied: 88.0% (4.0% by COVID-19 patients)
— 18.9% more full than Alabama overall
– ICU beds occupied: 102.0% (8.0% by COVID-19 patients)
— 20.0% more full than Alabama overall
– Cases per 100k in last 7 days: 66 (70 cases)
– Population that is fully vaccinated: 38.7% (40,980 fully vaccinated)
— 15.1% lower vaccination rate than Alabama
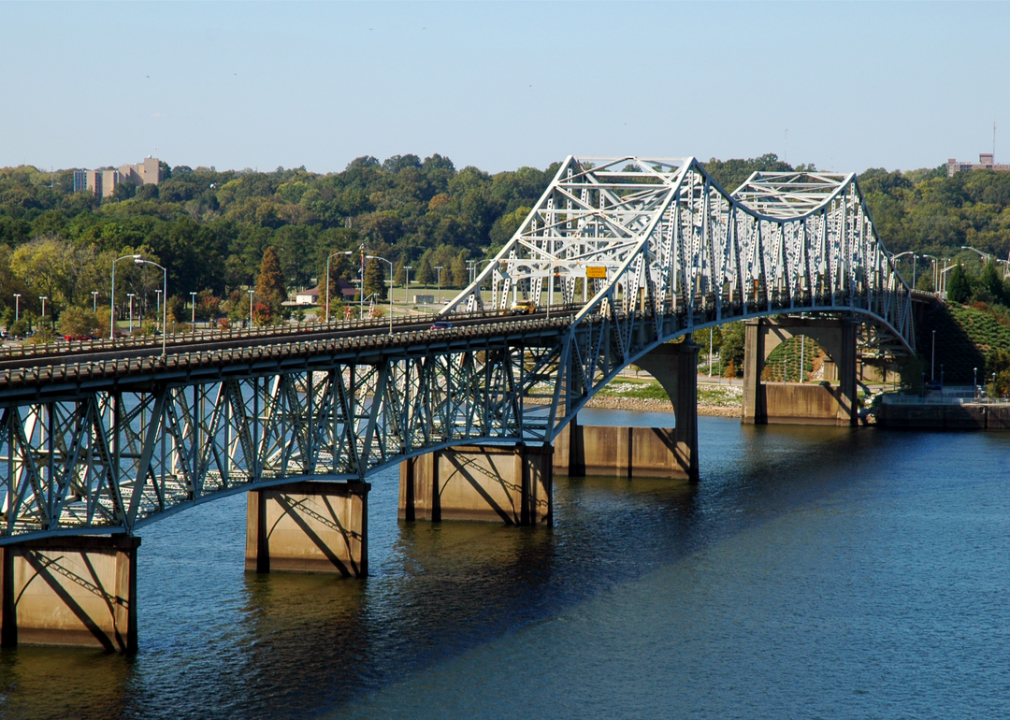
Wayne James // Shutterstock
#1. Lauderdale County, AL
– Inpatient beds occupied: 94.0% (3.0% by COVID-19 patients)
— 27.0% more full than Alabama overall
– ICU beds occupied: 79.0% (12.0% by COVID-19 patients)
— 7.1% more availability than Alabama overall
– Cases per 100k in last 7 days: 70 (65 cases)
– Population that is fully vaccinated: 42.3% (39,232 fully vaccinated)
— 7.2% lower vaccination rate than Alabama


