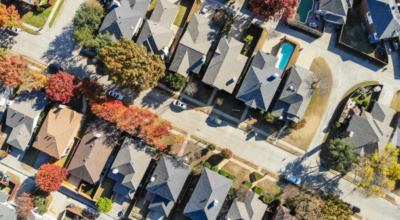
Fastest-growing counties in Alabama
Published 1:16 pm Thursday, September 23, 2021
Pixabay
Fastest-growing counties in Alabama
From 2019 to 2020, the U.S. population grew by .35%, its slowest rate since 1900. Declining births, increasing deaths largely due to the graying Baby Boomer population, and a crackdown on immigration have contributed to many states seeing net population losses in recent years.
But in other pockets of the country, populations are growing. These shifts can be due to job opportunities, high quality of life, easy commutability to job centers, low rents, or any combination of these or other factors. Stacker compiled a list of the fastest-growing counties in Alabama using data from the U.S. Census Bureau. Counties are ranked by the highest population growth from 2010 to 2020.
A county typically sees population growth as a “bedroom community” (a municipality with an atypically large commuting population) to a large city. These communities are typically quieter than their feeder cities, offer lower rents and a higher quality of living, and are remote enough to be immune to the feeder city’s crime, traffic, and crowds. Keep reading to see if your home county made the list.
![]()
Carol M. Highsmith // Wikimedia Commons
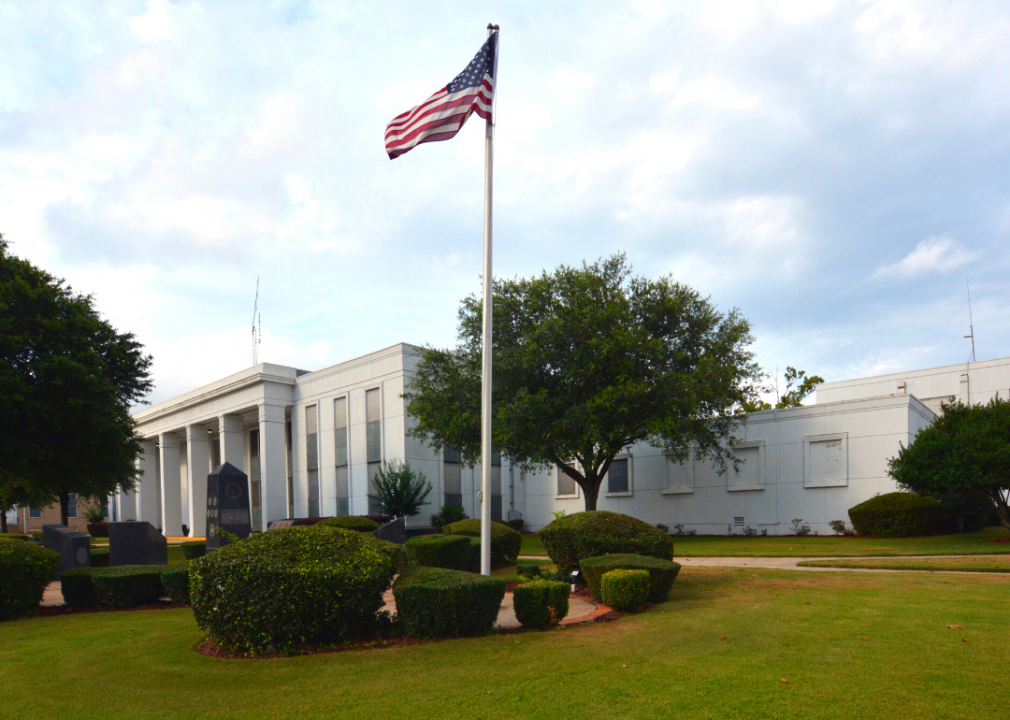
#50. Hale County
– 2010 to 2020 population change: -1,383
— #2,674 among all counties nationwide
– 2010 to 2020 percent population change: -8.6%
— #51 among counties in Alabama, #2,739 among all counties nationwide
– 2020 population: 14,785
— #55 largest county in Alabama, #2,097 largest county nationwide
Canva
#49. Escambia County
– 2010 to 2020 population change: -1,239
— #2,625 among all counties nationwide
– 2010 to 2020 percent population change: -3.3%
— #40 among counties in Alabama, #2,050 among all counties nationwide
– 2020 population: 36,757
— #33 largest county in Alabama, #1,261 largest county nationwide
Canva
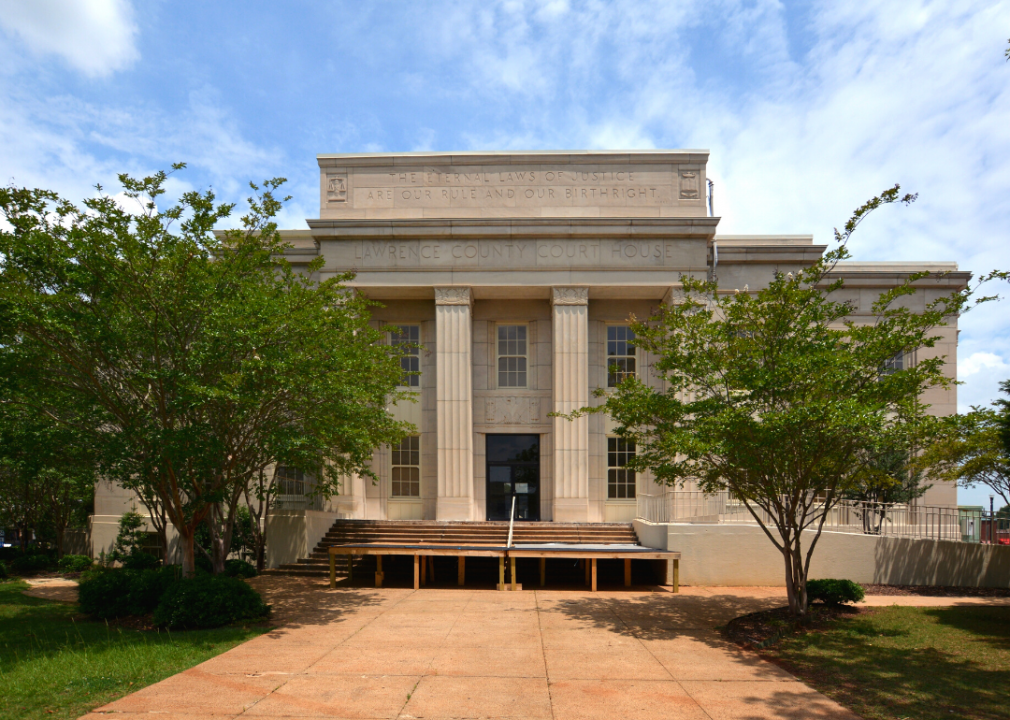
#48. Lawrence County
– 2010 to 2020 population change: -1,162
— #2,588 among all counties nationwide
– 2010 to 2020 percent population change: -3.4%
— #42 among counties in Alabama, #2,079 among all counties nationwide
– 2020 population: 33,073
— #35 largest county in Alabama, #1,356 largest county nationwide
Canva
#47. Fayette County
– 2010 to 2020 population change: -1,151
— #2,579 among all counties nationwide
– 2010 to 2020 percent population change: -6.6%
— #50 among counties in Alabama, #2,552 among all counties nationwide
– 2020 population: 16,321
— #52 largest county in Alabama, #2,014 largest county nationwide
Canva
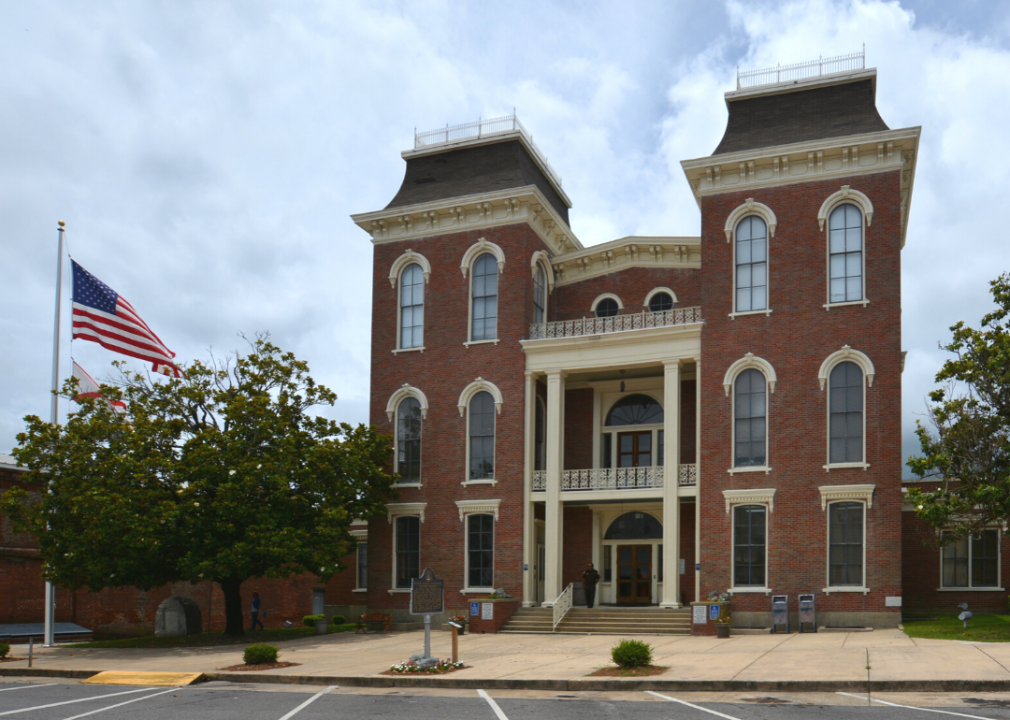
#46. Winston County
– 2010 to 2020 population change: -1,147
— #2,576 among all counties nationwide
– 2010 to 2020 percent population change: -4.6%
— #45 among counties in Alabama, #2,250 among all counties nationwide
– 2020 population: 23,540
— #42 largest county in Alabama, #1,653 largest county nationwide
Rivers A. Langley; SaveRivers // Wikimedia Commons
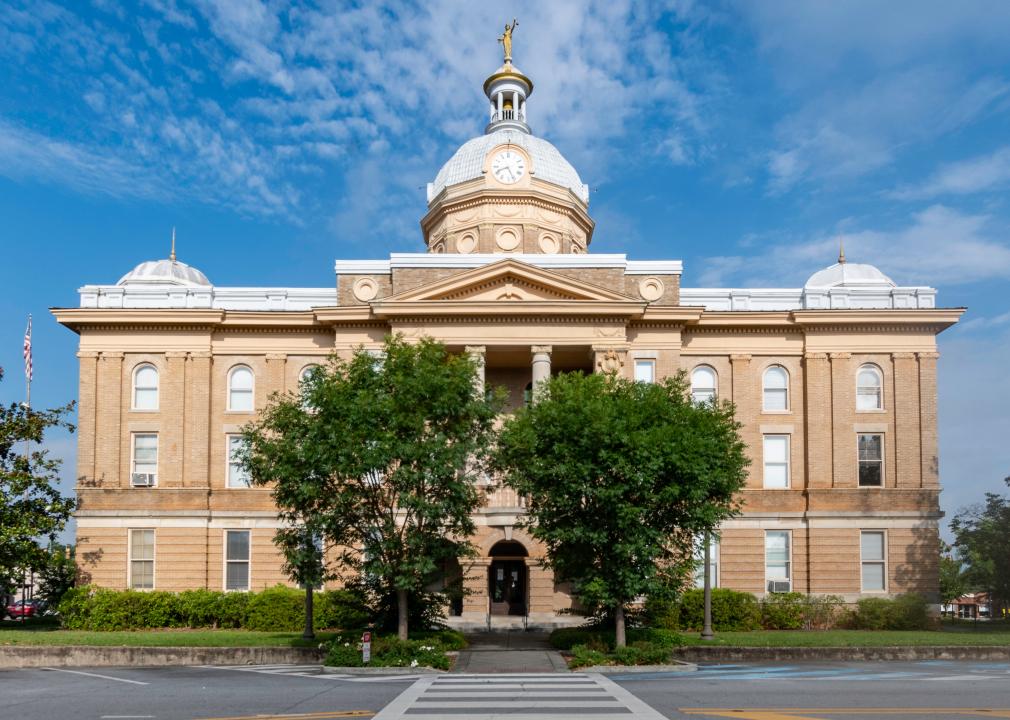
#45. Coosa County
– 2010 to 2020 population change: -1,083
— #2,547 among all counties nationwide
– 2010 to 2020 percent population change: -9.4%
— #55 among counties in Alabama, #2,812 among all counties nationwide
– 2020 population: 10,387
— #63 largest county in Alabama, #2,383 largest county nationwide
Rivers A. Langley; SaveRivers // Wikimedia Commons
#44. Randolph County
– 2010 to 2020 population change: -850
— #2,427 among all counties nationwide
– 2010 to 2020 percent population change: -3.7%
— #43 among counties in Alabama, #2,123 among all counties nationwide
– 2020 population: 21,967
— #45 largest county in Alabama, #1,715 largest county nationwide
Springfieldohio // Wikimedia Commons
#43. Jackson County
– 2010 to 2020 population change: -807
— #2,404 among all counties nationwide
– 2010 to 2020 percent population change: -1.5%
— #38 among counties in Alabama, #1,790 among all counties nationwide
– 2020 population: 52,579
— #27 largest county in Alabama, #955 largest county nationwide
Public Domain
#42. Pickens County
– 2010 to 2020 population change: -794
— #2,400 among all counties nationwide
– 2010 to 2020 percent population change: -4.0%
— #44 among counties in Alabama, #2,167 among all counties nationwide
– 2020 population: 19,123
— #49 largest county in Alabama, #1,864 largest county nationwide
Myself – Nathon Morris // Wikimedia Commons
#41. Lamar County
– 2010 to 2020 population change: -771
— #2,382 among all counties nationwide
– 2010 to 2020 percent population change: -5.2%
— #48 among counties in Alabama, #2,338 among all counties nationwide
– 2020 population: 13,972
— #57 largest county in Alabama, #2,157 largest county nationwide
Rivers Langley; SaveRivers // Wikimedia Commons
#40. Crenshaw County
– 2010 to 2020 population change: -734
— #2,361 among all counties nationwide
– 2010 to 2020 percent population change: -5.3%
— #49 among counties in Alabama, #2,347 among all counties nationwide
– 2020 population: 13,194
— #58 largest county in Alabama, #2,203 largest county nationwide
Rudi Weikard // Wikimedia Commons
#39. Cherokee County
– 2010 to 2020 population change: -729
— #2,357 among all counties nationwide
– 2010 to 2020 percent population change: -2.8%
— #39 among counties in Alabama, #1,994 among all counties nationwide
– 2020 population: 24,971
— #41 largest county in Alabama, #1,603 largest county nationwide
Rivers Langley; SaveRivers // Wikimedia Commons
#38. Calhoun County
– 2010 to 2020 population change: -708
— #2,338 among all counties nationwide
– 2010 to 2020 percent population change: -0.6%
— #34 among counties in Alabama, #1,663 among all counties nationwide
– 2020 population: 116,441
— #10 largest county in Alabama, #539 largest county nationwide
Prestinian // Wikimedia Commons
#37. Etowah County
– 2010 to 2020 population change: -630
— #2,278 among all counties nationwide
– 2010 to 2020 percent population change: -0.6%
— #35 among counties in Alabama, #1,664 among all counties nationwide
– 2020 population: 103,436
— #13 largest county in Alabama, #592 largest county nationwide
Canva
#36. Bullock County
– 2010 to 2020 population change: -566
— #2,225 among all counties nationwide
– 2010 to 2020 percent population change: -5.2%
— #47 among counties in Alabama, #2,328 among all counties nationwide
– 2020 population: 10,357
— #64 largest county in Alabama, #2,385 largest county nationwide
Michael Rivera // Wikimedia Commons
#35. Dale County
– 2010 to 2020 population change: -404
— #2,062 among all counties nationwide
– 2010 to 2020 percent population change: -0.8%
— #36 among counties in Alabama, #1,692 among all counties nationwide
– 2020 population: 49,326
— #28 largest county in Alabama, #1,003 largest county nationwide
Canva
#34. Bibb County
– 2010 to 2020 population change: -317
— #1,956 among all counties nationwide
– 2010 to 2020 percent population change: -1.4%
— #37 among counties in Alabama, #1,776 among all counties nationwide
– 2020 population: 22,293
— #44 largest county in Alabama, #1,699 largest county nationwide
Rivers A. Langley; SaveRivers // Wikimedia Commons
#33. Tallapoosa County
– 2010 to 2020 population change: -223
— #1,844 among all counties nationwide
– 2010 to 2020 percent population change: -0.5%
— #33 among counties in Alabama, #1,652 among all counties nationwide
– 2020 population: 41,311
— #30 largest county in Alabama, #1,155 largest county nationwide
Rivers Langley; SaveRivers // Wikimedia Commons
#32. Talladega County
– 2010 to 2020 population change: -198
— #1,812 among all counties nationwide
– 2010 to 2020 percent population change: -0.2%
— #32 among counties in Alabama, #1,605 among all counties nationwide
– 2020 population: 82,149
— #19 largest county in Alabama, #698 largest county nationwide
Chris Pruitt // Wikimedia Commons
#31. Covington County
– 2010 to 2020 population change: -38
— #1,611 among all counties nationwide
– 2010 to 2020 percent population change: -0.1%
— #31 among counties in Alabama, #1,580 among all counties nationwide
– 2020 population: 37,570
— #32 largest county in Alabama, #1,232 largest county nationwide
Rivers Langley; SaveRivers // Wikimedia Commons
#30. Henry County
– 2010 to 2020 population change: -2
— #1,565 among all counties nationwide
– 2010 to 2020 percent population change: 0.0%
— #30 among counties in Alabama, #1,564 among all counties nationwide
– 2020 population: 17,146
— #51 largest county in Alabama, #1,959 largest county nationwide
Wmr36104 // Wikimedia Commons
#29. Geneva County
– 2010 to 2020 population change: 118
— #1,454 among all counties nationwide
– 2010 to 2020 percent population change: +0.4%
— #28 among counties in Alabama, #1,500 among all counties nationwide
– 2020 population: 26,659
— #39 largest county in Alabama, #1,542 largest county nationwide
Rivers Langley; SaveRivers // Wikimedia Commons
#28. Chambers County
– 2010 to 2020 population change: 193
— #1,406 among all counties nationwide
– 2010 to 2020 percent population change: +0.6%
— #27 among counties in Alabama, #1,484 among all counties nationwide
– 2020 population: 34,772
— #34 largest county in Alabama, #1,305 largest county nationwide
JNix // Shutterstock
#27. Clay County
– 2010 to 2020 population change: 196
— #1,402 among all counties nationwide
– 2010 to 2020 percent population change: +1.4%
— #26 among counties in Alabama, #1,377 among all counties nationwide
– 2020 population: 14,236
— #56 largest county in Alabama, #2,131 largest county nationwide
Rivers Langley; SaveRivers // Wikimedia Commons
#26. Cleburne County
– 2010 to 2020 population change: 233
— #1,381 among all counties nationwide
– 2010 to 2020 percent population change: +1.6%
— #24 among counties in Alabama, #1,339 among all counties nationwide
– 2020 population: 15,056
— #54 largest county in Alabama, #2,081 largest county nationwide
Rudi Weikard // Wikimedia Commons
#25. Franklin County
– 2010 to 2020 population change: 730
— #1,151 among all counties nationwide
– 2010 to 2020 percent population change: +2.3%
— #21 among counties in Alabama, #1,245 among all counties nationwide
– 2020 population: 32,113
— #37 largest county in Alabama, #1,380 largest county nationwide
Kreeder13 // Wikimedia Commons
#24. Pike County
– 2010 to 2020 population change: 862
— #1,115 among all counties nationwide
– 2010 to 2020 percent population change: +2.7%
— #20 among counties in Alabama, #1,196 among all counties nationwide
– 2020 population: 33,009
— #36 largest county in Alabama, #1,359 largest county nationwide
Chris Pruitt // wikicommons
#23. Montgomery County
– 2010 to 2020 population change: 936
— #1,097 among all counties nationwide
– 2010 to 2020 percent population change: +0.4%
— #29 among counties in Alabama, #1,506 among all counties nationwide
– 2020 population: 228,954
— #5 largest county in Alabama, #301 largest county nationwide
Canva
#22. DeKalb County
– 2010 to 2020 population change: 1,570
— #959 among all counties nationwide
– 2010 to 2020 percent population change: +2.2%
— #22 among counties in Alabama, #1,260 among all counties nationwide
– 2020 population: 71,608
— #20 largest county in Alabama, #764 largest county nationwide
Wayne James // Shutterstock
#21. Lauderdale County
– 2010 to 2020 population change: 1,802
— #933 among all counties nationwide
– 2010 to 2020 percent population change: +2.0%
— #23 among counties in Alabama, #1,292 among all counties nationwide
– 2020 population: 93,564
— #15 largest county in Alabama, #642 largest county nationwide
Canva
#20. Chilton County
– 2010 to 2020 population change: 1,893
— #921 among all counties nationwide
– 2010 to 2020 percent population change: +4.4%
— #17 among counties in Alabama, #991 among all counties nationwide
– 2020 population: 45,014
— #29 largest county in Alabama, #1,069 largest county nationwide
Rudi Weikard // Wikimedia Commons
#19. Blount County
– 2010 to 2020 population change: 2,442
— #833 among all counties nationwide
– 2010 to 2020 percent population change: +4.3%
— #18 among counties in Alabama, #996 among all counties nationwide
– 2020 population: 59,134
— #23 largest county in Alabama, #882 largest county nationwide
Dailynetworks // Wikimedia Commons
#18. Colbert County
– 2010 to 2020 population change: 2,781
— #793 among all counties nationwide
– 2010 to 2020 percent population change: +5.1%
— #15 among counties in Alabama, #922 among all counties nationwide
– 2020 population: 57,227
— #25 largest county in Alabama, #910 largest county nationwide
Calvin Beale // Wikimedia Commons
#17. Coffee County
– 2010 to 2020 population change: 5,116
— #623 among all counties nationwide
– 2010 to 2020 percent population change: +10.6%
— #11 among counties in Alabama, #526 among all counties nationwide
– 2020 population: 53,465
— #26 largest county in Alabama, #942 largest county nationwide
Chris Pruitt // Wikimedia Commons
#16. Autauga County
– 2010 to 2020 population change: 5,650
— #597 among all counties nationwide
– 2010 to 2020 percent population change: +10.6%
— #10 among counties in Alabama, #520 among all counties nationwide
– 2020 population: 58,805
— #24 largest county in Alabama, #886 largest county nationwide
MPearsallArt // Wikimedia Commons
#15. Morgan County
– 2010 to 2020 population change: 5,789
— #592 among all counties nationwide
– 2010 to 2020 percent population change: +4.9%
— #16 among counties in Alabama, #943 among all counties nationwide
– 2020 population: 123,421
— #9 largest county in Alabama, #515 largest county nationwide
Altairisfar // Wikicommons
#14. Mobile County
– 2010 to 2020 population change: 6,189
— #581 among all counties nationwide
– 2010 to 2020 percent population change: +1.5%
— #25 among counties in Alabama, #1,351 among all counties nationwide
– 2020 population: 414,809
— #2 largest county in Alabama, #173 largest county nationwide
Canva
#13. Marshall County
– 2010 to 2020 population change: 6,745
— #559 among all counties nationwide
– 2010 to 2020 percent population change: +7.4%
— #14 among counties in Alabama, #737 among all counties nationwide
– 2020 population: 97,612
— #14 largest county in Alabama, #621 largest county nationwide
Rivers Langley SaveRivers // Wikimedia Commons
#12. Russell County
– 2010 to 2020 population change: 7,520
— #538 among all counties nationwide
– 2010 to 2020 percent population change: +14.6%
— #7 among counties in Alabama, #333 among all counties nationwide
– 2020 population: 59,183
— #22 largest county in Alabama, #881 largest county nationwide
Chris Pruitt // Wikimedia Commons
#11. Cullman County
– 2010 to 2020 population change: 7,925
— #529 among all counties nationwide
– 2010 to 2020 percent population change: +9.9%
— #12 among counties in Alabama, #564 among all counties nationwide
– 2020 population: 87,866
— #18 largest county in Alabama, #666 largest county nationwide
Carol M. Highsmith/Library of Congress // Wikimedia Commons
#10. Houston County
– 2010 to 2020 population change: 8,173
— #520 among all counties nationwide
– 2010 to 2020 percent population change: +8.3%
— #13 among counties in Alabama, #673 among all counties nationwide
– 2020 population: 107,202
— #11 largest county in Alabama, #571 largest county nationwide
Rivers A. Langley; SaveRivers // Wikimedia Commons
#9. Elmore County
– 2010 to 2020 population change: 10,327
— #472 among all counties nationwide
– 2010 to 2020 percent population change: +13.3%
— #8 among counties in Alabama, #377 among all counties nationwide
– 2020 population: 87,977
— #17 largest county in Alabama, #665 largest county nationwide
Rudi Weikard // Wikimedia Commons
#8. St. Clair County
– 2010 to 2020 population change: 10,445
— #467 among all counties nationwide
– 2010 to 2020 percent population change: +12.9%
— #9 among counties in Alabama, #396 among all counties nationwide
– 2020 population: 91,103
— #16 largest county in Alabama, #657 largest county nationwide
M Floyd // Flickr
#7. Jefferson County
– 2010 to 2020 population change: 17,809
— #351 among all counties nationwide
– 2010 to 2020 percent population change: +2.7%
— #19 among counties in Alabama, #1,191 among all counties nationwide
– 2020 population: 674,721
— #1 largest county in Alabama, #101 largest county nationwide
Carol M. Highsmith // Wikimedia Commons
#6. Limestone County
– 2010 to 2020 population change: 24,956
— #281 among all counties nationwide
– 2010 to 2020 percent population change: +31.7%
— #2 among counties in Alabama, #64 among all counties nationwide
– 2020 population: 103,570
— #12 largest county in Alabama, #591 largest county nationwide
Rivers Langley; SaveRivers // Wikimedia Commons
#5. Shelby County
– 2010 to 2020 population change: 35,144
— #213 among all counties nationwide
– 2010 to 2020 percent population change: +18.7%
— #6 among counties in Alabama, #213 among all counties nationwide
– 2020 population: 223,024
— #7 largest county in Alabama, #312 largest county nationwide
Tracy Burroughs Brown // Shutterstock
#4. Tuscaloosa County
– 2010 to 2020 population change: 38,705
— #194 among all counties nationwide
– 2010 to 2020 percent population change: +20.6%
— #4 among counties in Alabama, #176 among all counties nationwide
– 2020 population: 227,036
— #6 largest county in Alabama, #305 largest county nationwide
Library of Congress
#3. Lee County
– 2010 to 2020 population change: 39,231
— #192 among all counties nationwide
– 2010 to 2020 percent population change: +29.1%
— #3 among counties in Alabama, #79 among all counties nationwide
– 2020 population: 174,241
— #8 largest county in Alabama, #381 largest county nationwide
Jodybwiki // Wikimedia Commons
#2. Baldwin County
– 2010 to 2020 population change: 55,976
— #135 among all counties nationwide
– 2010 to 2020 percent population change: +31.8%
— #1 among counties in Alabama, #63 among all counties nationwide
– 2020 population: 231,767
— #4 largest county in Alabama, #296 largest county nationwide
Pixabay
#1. Madison County
– 2010 to 2020 population change: 65,073
— #118 among all counties nationwide
– 2010 to 2020 percent population change: +20.1%
— #5 among counties in Alabama, #189 among all counties nationwide
– 2020 population: 388,153
— #3 largest county in Alabama, #184 largest county nationwide


