Counties with the lowest hospital bed capacity in Alabama
Published 11:41 am Friday, September 17, 2021
Rudi Weikard // Wikimedia Commons
Counties with the lowest hospital bed capacity in Alabama
The deployment of vaccines beginning in December signaled a turning point in the pandemic. By Feb. 2,more Americans had been vaccinated for COVID-19 than had been infected. But as vaccination rates lagged over the summer, new surges of COVID-19 came. More than 80% of these cases by late July were caused by the Delta variant, which is more contagious than the original virus. This has resulted in growing rates of community transmission and—especially in areas with lower vaccination rates—increasing rates of hospitalization and death.
The United States reached 666,969 COVID-19-related deaths and nearly 41.6 million COVID-19 cases as of Sep. 16, according to Johns Hopkins University.
Currently, 54.1% of the U.S. population is fully vaccinated. Epidemiologists say the lower the vaccination rate, the more the virus has the opportunity to continue to evolve and become more dangerous.
Stacker compiled a list of the counties with the lowest in-patient bed capacity in Alabama using data from the U.S. Department of Health & Human Services. Counties are ranked by the percent of in-patient hospital beds filled as of Sep. 15, with ICU availability serving as a tiebreaker. Hospitalization data was available for about 77% of counties in the U.S. Keep reading to see what hospital capacity looks like in your county.
![]()

Canva
#50. Greene County, AL
– Inpatient beds occupied: 40.0% (0.0% by COVID-19 patients)
— 50.0% more availability than Alabama overall
– ICU beds occupied: data not available
— 95% full in Alabama overall
– Cases per 100k in last 7 days: 259 (21 cases)
– Population that is fully vaccinated: 38.9% (3,157 fully vaccinated)
— 47.3% lower vaccination rate than Alabama
Canva
#49. Bibb County, AL
– Inpatient beds occupied: 41.0% (14.0% by COVID-19 patients)
— 48.8% more availability than Alabama overall
– ICU beds occupied: data not available
— 95% full in Alabama overall
– Cases per 100k in last 7 days: 884 (198 cases)
– Population that is fully vaccinated: 28.0% (6,277 fully vaccinated)
— 62.1% lower vaccination rate than Alabama
Rivers A. Langley; SaveRivers // Wikimedia Commons
#48. Randolph County, AL
– Inpatient beds occupied: 44.0% (12.0% by COVID-19 patients)
— 45.0% more availability than Alabama overall
– ICU beds occupied: data not available
— 95% full in Alabama overall
– Cases per 100k in last 7 days: 819 (186 cases)
– Population that is fully vaccinated: 26.4% (5,992 fully vaccinated)
— 64.2% lower vaccination rate than Alabama
Canva
#47. Bullock County, AL
– Inpatient beds occupied: 44.0% (0.0% by COVID-19 patients)
— 45.0% more availability than Alabama overall
– ICU beds occupied: data not available
— 95% full in Alabama overall
– Cases per 100k in last 7 days: 287 (29 cases)
– Population that is fully vaccinated: 41.0% (4,143 fully vaccinated)
— 44.4% lower vaccination rate than Alabama
JNix // Shutterstock
#46. Clay County, AL
– Inpatient beds occupied: 45.0% (15.0% by COVID-19 patients)
— 43.8% more availability than Alabama overall
– ICU beds occupied: 100.0% (100.0% by COVID-19 patients)
— 5.3% more full than Alabama overall
– Cases per 100k in last 7 days: 846 (112 cases)
– Population that is fully vaccinated: 33.2% (4,388 fully vaccinated)
— 55.0% lower vaccination rate than Alabama
Rivers A. Langley; SaveRivers // Wikimedia Commons
#45. Tallapoosa County, AL
– Inpatient beds occupied: 46.0% (20.0% by COVID-19 patients)
— 42.5% more availability than Alabama overall
– ICU beds occupied: 117.0% (71.0% by COVID-19 patients)
— 23.2% more full than Alabama overall
– Cases per 100k in last 7 days: 810 (327 cases)
– Population that is fully vaccinated: 32.0% (12,933 fully vaccinated)
— 56.6% lower vaccination rate than Alabama
Rivers Langley; SaveRivers // Wikimedia Commons
#44. Crenshaw County, AL
– Inpatient beds occupied: 47.0% (13.0% by COVID-19 patients)
— 41.3% more availability than Alabama overall
– ICU beds occupied: data not available
— 95% full in Alabama overall
– Cases per 100k in last 7 days: 588 (81 cases)
– Population that is fully vaccinated: 27.6% (3,803 fully vaccinated)
— 62.6% lower vaccination rate than Alabama
Rudi Weikard // Wikimedia Commons
#43. Marion County, AL
– Inpatient beds occupied: 49.0% (10.0% by COVID-19 patients)
— 38.8% more availability than Alabama overall
– ICU beds occupied: 89.0% (32.0% by COVID-19 patients)
— 6.3% more availability than Alabama overall
– Cases per 100k in last 7 days: 720 (214 cases)
– Population that is fully vaccinated: 29.5% (8,772 fully vaccinated)
— 60.0% lower vaccination rate than Alabama
Canva
#42. Escambia County, AL
– Inpatient beds occupied: 52.0% (15.0% by COVID-19 patients)
— 35.0% more availability than Alabama overall
– ICU beds occupied: 78.0% (55.0% by COVID-19 patients)
— 17.9% more availability than Alabama overall
– Cases per 100k in last 7 days: 778 (285 cases)
– Population that is fully vaccinated: 28.0% (10,262 fully vaccinated)
— 62.1% lower vaccination rate than Alabama
Carol M. Highsmith // Wikimedia Commons
#41. Hale County, AL
– Inpatient beds occupied: 54.0% (33.0% by COVID-19 patients)
— 32.5% more availability than Alabama overall
– ICU beds occupied: data not available
— 95% full in Alabama overall
– Cases per 100k in last 7 days: 334 (49 cases)
– Population that is fully vaccinated: 49.6% (7,264 fully vaccinated)
— 32.8% lower vaccination rate than Alabama
DXR // Wikimedia Commons
#40. Dallas County, AL
– Inpatient beds occupied: 60.0% (16.0% by COVID-19 patients)
— 25.0% more availability than Alabama overall
– ICU beds occupied: 97.0% (63.0% by COVID-19 patients)
— 2.1% more full than Alabama overall
– Cases per 100k in last 7 days: 306 (114 cases)
– Population that is fully vaccinated: 33.2% (12,359 fully vaccinated)
— 55.0% lower vaccination rate than Alabama
Rudi Weikard // Wikimedia Commons
#39. Blount County, AL
– Inpatient beds occupied: 61.0% (14.0% by COVID-19 patients)
— 23.8% more availability than Alabama overall
– ICU beds occupied: 64.0% (40.0% by COVID-19 patients)
— 32.6% more availability than Alabama overall
– Cases per 100k in last 7 days: 510 (295 cases)
– Population that is fully vaccinated: 24.1% (13,937 fully vaccinated)
— 67.3% lower vaccination rate than Alabama
Rudi Weikard // Wikimedia Commons
#38. Franklin County, AL
– Inpatient beds occupied: 62.0% (12.0% by COVID-19 patients)
— 22.5% more availability than Alabama overall
– ICU beds occupied: 64.0% (29.0% by COVID-19 patients)
— 32.6% more availability than Alabama overall
– Cases per 100k in last 7 days: 571 (179 cases)
– Population that is fully vaccinated: 35.3% (11,082 fully vaccinated)
— 52.2% lower vaccination rate than Alabama
Rivers Langley; SaveRivers // Wikimedia Commons
#37. Barbour County, AL
– Inpatient beds occupied: 62.0% (20.0% by COVID-19 patients)
— 22.5% more availability than Alabama overall
– ICU beds occupied: 100.0% (29.0% by COVID-19 patients)
— 5.3% more full than Alabama overall
– Cases per 100k in last 7 days: 494 (122 cases)
– Population that is fully vaccinated: 33.3% (8,230 fully vaccinated)
— 54.9% lower vaccination rate than Alabama
Chris Pruitt // Wikimedia Commons
#36. Butler County, AL
– Inpatient beds occupied: 64.0% (25.0% by COVID-19 patients)
— 20.0% more availability than Alabama overall
– ICU beds occupied: 84.0% (59.0% by COVID-19 patients)
— 11.6% more availability than Alabama overall
– Cases per 100k in last 7 days: 576 (112 cases)
– Population that is fully vaccinated: 31.3% (6,078 fully vaccinated)
— 57.6% lower vaccination rate than Alabama
Carol M. Highsmith // Wikimedia Commons
#35. Monroe County, AL
– Inpatient beds occupied: 66.0% (25.0% by COVID-19 patients)
— 17.5% more availability than Alabama overall
– ICU beds occupied: 95.0% (75.0% by COVID-19 patients)
— 0.0% more availability than Alabama overall
– Cases per 100k in last 7 days: 516 (107 cases)
– Population that is fully vaccinated: 34.3% (7,111 fully vaccinated)
— 53.5% lower vaccination rate than Alabama
Dailynetworks // Wikimedia Commons
#34. Colbert County, AL
– Inpatient beds occupied: 66.0% (14.0% by COVID-19 patients)
— 17.5% more availability than Alabama overall
– ICU beds occupied: data not available
— 95% full in Alabama overall
– Cases per 100k in last 7 days: 431 (238 cases)
– Population that is fully vaccinated: 40.0% (22,082 fully vaccinated)
— 45.8% lower vaccination rate than Alabama
Canva
#33. Chilton County, AL
– Inpatient beds occupied: 68.0% (29.0% by COVID-19 patients)
— 15.0% more availability than Alabama overall
– ICU beds occupied: 79.0% (71.0% by COVID-19 patients)
— 16.8% more availability than Alabama overall
– Cases per 100k in last 7 days: 556 (247 cases)
– Population that is fully vaccinated: 28.0% (12,426 fully vaccinated)
— 62.1% lower vaccination rate than Alabama
Wmr36104 // Wikimedia Commons
#32. Geneva County, AL
– Inpatient beds occupied: 68.0% (20.0% by COVID-19 patients)
— 15.0% more availability than Alabama overall
– ICU beds occupied: 93.0% (55.0% by COVID-19 patients)
— 2.1% more availability than Alabama overall
– Cases per 100k in last 7 days: 757 (199 cases)
– Population that is fully vaccinated: 30.8% (8,080 fully vaccinated)
— 58.3% lower vaccination rate than Alabama
Canva
#31. Fayette County, AL
– Inpatient beds occupied: 69.0% (36.0% by COVID-19 patients)
— 13.8% more availability than Alabama overall
– ICU beds occupied: 7.0% (.0% by COVID-19 patients)
— 92.6% more availability than Alabama overall
– Cases per 100k in last 7 days: 638 (104 cases)
– Population that is fully vaccinated: 28.1% (4,578 fully vaccinated)
— 61.9% lower vaccination rate than Alabama
Canva
#30. DeKalb County, AL
– Inpatient beds occupied: 70.0% (20.0% by COVID-19 patients)
— 12.5% more availability than Alabama overall
– ICU beds occupied: 93.0% (69.0% by COVID-19 patients)
— 2.1% more availability than Alabama overall
– Cases per 100k in last 7 days: 523 (374 cases)
– Population that is fully vaccinated: 25.7% (18,405 fully vaccinated)
— 65.2% lower vaccination rate than Alabama
Kreeder13 // Wikimedia Commons
#29. Pike County, AL
– Inpatient beds occupied: 71.0% (20.0% by COVID-19 patients)
— 11.3% more availability than Alabama overall
– ICU beds occupied: 100.0% (81.0% by COVID-19 patients)
— 5.3% more full than Alabama overall
– Cases per 100k in last 7 days: 619 (205 cases)
– Population that is fully vaccinated: 32.6% (10,804 fully vaccinated)
— 55.8% lower vaccination rate than Alabama
Canva
#28. Walker County, AL
– Inpatient beds occupied: 71.0% (27.0% by COVID-19 patients)
— 11.3% more availability than Alabama overall
– ICU beds occupied: 104.0% (85.0% by COVID-19 patients)
— 9.5% more full than Alabama overall
– Cases per 100k in last 7 days: 701 (445 cases)
– Population that is fully vaccinated: 37.9% (24,062 fully vaccinated)
— 48.6% lower vaccination rate than Alabama
Springfieldohio // Wikimedia Commons
#27. Jackson County, AL
– Inpatient beds occupied: 72.0% (19.0% by COVID-19 patients)
— 10.0% more availability than Alabama overall
– ICU beds occupied: 97.0% (61.0% by COVID-19 patients)
— 2.1% more full than Alabama overall
– Cases per 100k in last 7 days: 655 (338 cases)
– Population that is fully vaccinated: 38.1% (19,685 fully vaccinated)
— 48.4% lower vaccination rate than Alabama
Canva
#26. Marshall County, AL
– Inpatient beds occupied: 72.0% (30.0% by COVID-19 patients)
— 10.0% more availability than Alabama overall
– ICU beds occupied: 100.0% (60.0% by COVID-19 patients)
— 5.3% more full than Alabama overall
– Cases per 100k in last 7 days: 637 (616 cases)
– Population that is fully vaccinated: 35.3% (34,140 fully vaccinated)
— 52.2% lower vaccination rate than Alabama
Chris Pruitt // wikicommons
#25. Montgomery County, AL
– Inpatient beds occupied: 74.0% (18.0% by COVID-19 patients)
— 7.5% more availability than Alabama overall
– ICU beds occupied: 95.0% (43.0% by COVID-19 patients)
— 0.0% more availability than Alabama overall
– Cases per 100k in last 7 days: 359 (814 cases)
– Population that is fully vaccinated: 41.7% (94,479 fully vaccinated)
— 43.5% lower vaccination rate than Alabama
Rivers Langley; SaveRivers // Wikimedia Commons
#24. Chambers County, AL
– Inpatient beds occupied: 75.0% (12.0% by COVID-19 patients)
— 6.3% more availability than Alabama overall
– ICU beds occupied: data not available
— 95% full in Alabama overall
– Cases per 100k in last 7 days: 586 (195 cases)
– Population that is fully vaccinated: 25.2% (8,376 fully vaccinated)
— 65.9% lower vaccination rate than Alabama
Chris Pruitt // Wikimedia Commons
#23. Autauga County, AL
– Inpatient beds occupied: 76.0% (39.0% by COVID-19 patients)
— 5.0% more availability than Alabama overall
– ICU beds occupied: 100.0% (83.0% by COVID-19 patients)
— 5.3% more full than Alabama overall
– Cases per 100k in last 7 days: 515 (288 cases)
– Population that is fully vaccinated: 31.9% (17,829 fully vaccinated)
— 56.8% lower vaccination rate than Alabama
Michael Rivera // Wikimedia Commons
#22. Dale County, AL
– Inpatient beds occupied: 76.0% (33.0% by COVID-19 patients)
— 5.0% more availability than Alabama overall
– ICU beds occupied: 100.0% (90.0% by COVID-19 patients)
— 5.3% more full than Alabama overall
– Cases per 100k in last 7 days: 578 (284 cases)
– Population that is fully vaccinated: 42.1% (20,679 fully vaccinated)
— 43.0% lower vaccination rate than Alabama
Rivers Langley; SaveRivers // Wikimedia Commons
#21. Talladega County, AL
– Inpatient beds occupied: 78.0% (27.0% by COVID-19 patients)
— 2.5% more availability than Alabama overall
– ICU beds occupied: 96.0% (72.0% by COVID-19 patients)
— 1.1% more full than Alabama overall
– Cases per 100k in last 7 days: 800 (640 cases)
– Population that is fully vaccinated: 29.9% (23,916 fully vaccinated)
— 59.5% lower vaccination rate than Alabama
Carol M. Highsmith // Wikimedia Commons
#20. Limestone County, AL
– Inpatient beds occupied: 78.0% (21.0% by COVID-19 patients)
— 2.5% more availability than Alabama overall
– ICU beds occupied: 96.0% (67.0% by COVID-19 patients)
— 1.1% more full than Alabama overall
– Cases per 100k in last 7 days: 610 (603 cases)
– Population that is fully vaccinated: 29.7% (29,408 fully vaccinated)
— 59.8% lower vaccination rate than Alabama
Calvin Beale // Wikimedia Commons
#19. Coffee County, AL
– Inpatient beds occupied: 79.0% (40.0% by COVID-19 patients)
— 1.3% more availability than Alabama overall
– ICU beds occupied: data not available
— 95% full in Alabama overall
– Cases per 100k in last 7 days: 468 (245 cases)
– Population that is fully vaccinated: 30.9% (16,190 fully vaccinated)
— 58.1% lower vaccination rate than Alabama
Canva
#18. Marengo County, AL
– Inpatient beds occupied: 80.0% (26.0% by COVID-19 patients)
— 0.0% more availability than Alabama overall
– ICU beds occupied: 91.0% (41.0% by COVID-19 patients)
— 4.2% more availability than Alabama overall
– Cases per 100k in last 7 days: 440 (83 cases)
– Population that is fully vaccinated: 43.5% (8,209 fully vaccinated)
— 41.1% lower vaccination rate than Alabama
Altairisfar // Wikicommons
#17. Mobile County, AL
– Inpatient beds occupied: 81.0% (16.0% by COVID-19 patients)
— 1.3% more full than Alabama overall
– ICU beds occupied: 95.0% (39.0% by COVID-19 patients)
— 0.0% more availability than Alabama overall
– Cases per 100k in last 7 days: 837 (3,460 cases)
– Population that is fully vaccinated: 39.3% (162,281 fully vaccinated)
— 46.7% lower vaccination rate than Alabama
MPearsallArt // Wikimedia Commons
#16. Morgan County, AL
– Inpatient beds occupied: 81.0% (29.0% by COVID-19 patients)
— 1.3% more full than Alabama overall
– ICU beds occupied: 104.0% (64.0% by COVID-19 patients)
— 9.5% more full than Alabama overall
– Cases per 100k in last 7 days: 617 (738 cases)
– Population that is fully vaccinated: 35.4% (42,361 fully vaccinated)
— 52.0% lower vaccination rate than Alabama
Wayne James // Shutterstock
#15. Lauderdale County, AL
– Inpatient beds occupied: 82.0% (16.0% by COVID-19 patients)
— 2.5% more full than Alabama overall
– ICU beds occupied: 91.0% (28.0% by COVID-19 patients)
— 4.2% more availability than Alabama overall
– Cases per 100k in last 7 days: 482 (447 cases)
– Population that is fully vaccinated: 38.6% (35,762 fully vaccinated)
— 47.7% lower vaccination rate than Alabama
Rivers Langley; SaveRivers // Wikimedia Commons
#14. Shelby County, AL
– Inpatient beds occupied: 82.0% (26.0% by COVID-19 patients)
— 2.5% more full than Alabama overall
– ICU beds occupied: 94.0% (57.0% by COVID-19 patients)
— 1.1% more availability than Alabama overall
– Cases per 100k in last 7 days: 516 (1,123 cases)
– Population that is fully vaccinated: 28.9% (63,002 fully vaccinated)
— 60.8% lower vaccination rate than Alabama
Chris Pruitt // Wikimedia Commons
#13. Conecuh County, AL
– Inpatient beds occupied: 82.0% (37.0% by COVID-19 patients)
— 2.5% more full than Alabama overall
– ICU beds occupied: data not available
— 95% full in Alabama overall
– Cases per 100k in last 7 days: 754 (91 cases)
– Population that is fully vaccinated: 33.7% (4,068 fully vaccinated)
— 54.3% lower vaccination rate than Alabama
M Floyd // Flickr
#12. Jefferson County, AL
– Inpatient beds occupied: 83.0% (13.0% by COVID-19 patients)
— 3.7% more full than Alabama overall
– ICU beds occupied: 95.0% (35.0% by COVID-19 patients)
— 0.0% more availability than Alabama overall
– Cases per 100k in last 7 days: 447 (2,942 cases)
– Population that is fully vaccinated: 46.8% (308,108 fully vaccinated)
— 36.6% lower vaccination rate than Alabama
Tracy Burroughs Brown // Shutterstock
#11. Tuscaloosa County, AL
– Inpatient beds occupied: 83.0% (22.0% by COVID-19 patients)
— 3.7% more full than Alabama overall
– ICU beds occupied: 98.0% (53.0% by COVID-19 patients)
— 3.2% more full than Alabama overall
– Cases per 100k in last 7 days: 543 (1,137 cases)
– Population that is fully vaccinated: 35.7% (74,780 fully vaccinated)
— 51.6% lower vaccination rate than Alabama
Prestinian // Wikimedia Commons
#10. Etowah County, AL
– Inpatient beds occupied: 84.0% (28.0% by COVID-19 patients)
— 5.0% more full than Alabama overall
– ICU beds occupied: 98.0% (59.0% by COVID-19 patients)
— 3.2% more full than Alabama overall
– Cases per 100k in last 7 days: 488 (499 cases)
– Population that is fully vaccinated: 32.2% (32,975 fully vaccinated)
— 56.4% lower vaccination rate than Alabama
Jodybwiki // Wikimedia Commons
#9. Baldwin County, AL
– Inpatient beds occupied: 85.0% (26.0% by COVID-19 patients)
— 6.2% more full than Alabama overall
– ICU beds occupied: 96.0% (52.0% by COVID-19 patients)
— 1.1% more full than Alabama overall
– Cases per 100k in last 7 days: 437 (975 cases)
– Population that is fully vaccinated: 40.3% (89,900 fully vaccinated)
— 45.4% lower vaccination rate than Alabama
Chris Pruitt // Wikimedia Commons
#8. Covington County, AL
– Inpatient beds occupied: 85.0% (24.0% by COVID-19 patients)
— 6.2% more full than Alabama overall
– ICU beds occupied: 100.0% (57.0% by COVID-19 patients)
— 5.3% more full than Alabama overall
– Cases per 100k in last 7 days: 605 (224 cases)
– Population that is fully vaccinated: 30.6% (11,322 fully vaccinated)
— 58.5% lower vaccination rate than Alabama
Pixabay
#7. Madison County, AL
– Inpatient beds occupied: 88.0% (20.0% by COVID-19 patients)
— 10.0% more full than Alabama overall
– ICU beds occupied: 96.0% (48.0% by COVID-19 patients)
— 1.1% more full than Alabama overall
– Cases per 100k in last 7 days: 478 (1,784 cases)
– Population that is fully vaccinated: 49.8% (185,689 fully vaccinated)
— 32.5% lower vaccination rate than Alabama
Rivers Langley SaveRivers // Wikimedia Commons
#6. Russell County, AL
– Inpatient beds occupied: 92.0% (22.0% by COVID-19 patients)
— 15.0% more full than Alabama overall
– ICU beds occupied: 100.0% (91.0% by COVID-19 patients)
— 5.3% more full than Alabama overall
– Cases per 100k in last 7 days: 290 (168 cases)
– Population that is fully vaccinated: 30.2% (17,503 fully vaccinated)
— 59.1% lower vaccination rate than Alabama
Rivers Langley; SaveRivers // Wikimedia Commons
#5. Calhoun County, AL
– Inpatient beds occupied: 94.0% (25.0% by COVID-19 patients)
— 17.5% more full than Alabama overall
– ICU beds occupied: 79.0% (12.0% by COVID-19 patients)
— 16.8% more availability than Alabama overall
– Cases per 100k in last 7 days: 702 (797 cases)
– Population that is fully vaccinated: 36.8% (41,822 fully vaccinated)
— 50.1% lower vaccination rate than Alabama
Carol M. Highsmith/Library of Congress // Wikimedia Commons
#4. Houston County, AL
– Inpatient beds occupied: 94.0% (24.0% by COVID-19 patients)
— 17.5% more full than Alabama overall
– ICU beds occupied: 103.0% (61.0% by COVID-19 patients)
— 8.4% more full than Alabama overall
– Cases per 100k in last 7 days: 494 (523 cases)
– Population that is fully vaccinated: 34.6% (36,628 fully vaccinated)
— 53.1% lower vaccination rate than Alabama
Library of Congress
#3. Lee County, AL
– Inpatient beds occupied: 95.0% (29.0% by COVID-19 patients)
— 18.8% more full than Alabama overall
– ICU beds occupied: data not available
— 95% full in Alabama overall
– Cases per 100k in last 7 days: 395 (650 cases)
– Population that is fully vaccinated: 32.4% (53,255 fully vaccinated)
— 56.1% lower vaccination rate than Alabama
Chris Pruitt // Wikimedia Commons
#2. Cullman County, AL
– Inpatient beds occupied: 95.0% (46.0% by COVID-19 patients)
— 18.8% more full than Alabama overall
– ICU beds occupied: data not available
— 95% full in Alabama overall
– Cases per 100k in last 7 days: 758 (635 cases)
– Population that is fully vaccinated: 31.6% (26,455 fully vaccinated)
— 57.2% lower vaccination rate than Alabama
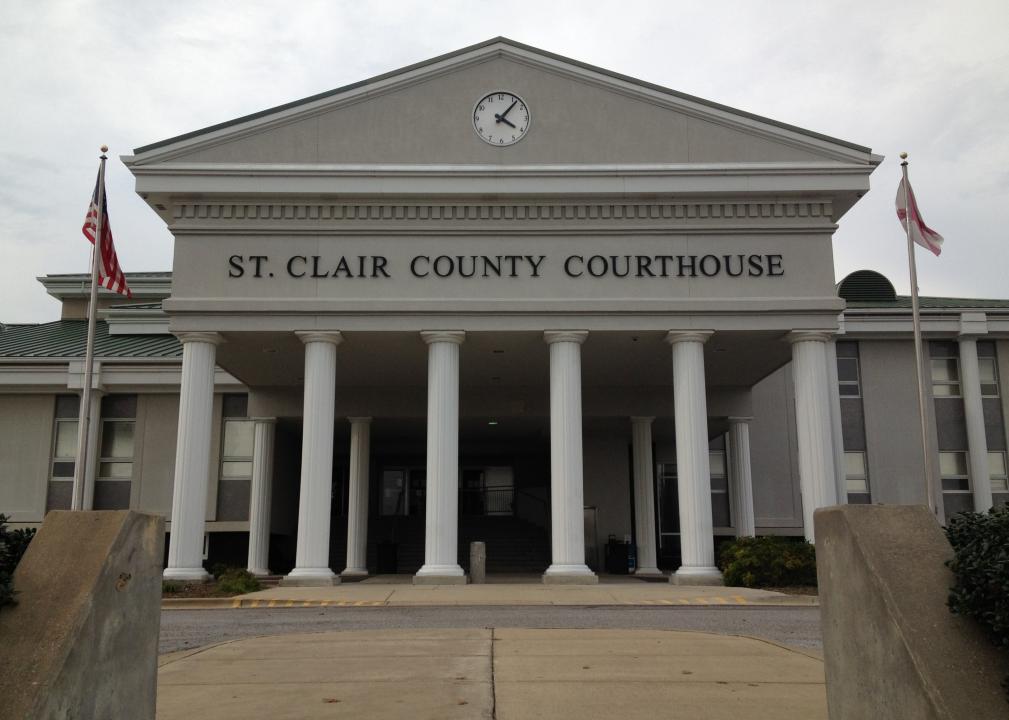
Rudi Weikard // Wikimedia Commons
#1. St. Clair County, AL
– Inpatient beds occupied: 101.0% (56.0% by COVID-19 patients)
— 26.3% more full than Alabama overall
– ICU beds occupied: 120.0% (87.0% by COVID-19 patients)
— 26.3% more full than Alabama overall
– Cases per 100k in last 7 days: 809 (724 cases)
– Population that is fully vaccinated: 31.1% (27,808 fully vaccinated)
— 57.9% lower vaccination rate than Alabama