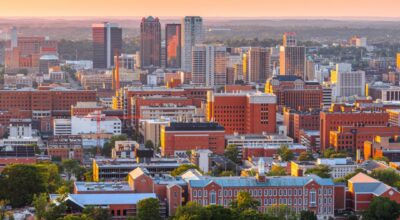
Counties with the lowest hospital bed capacity in Alabama
Published 11:33 am Friday, September 3, 2021
Rudi Weikard // Wikimedia Commons
Counties with the lowest hospital bed capacity in Alabama
The deployment of vaccines beginning in December signaled a turning point in the pandemic. By Feb. 2,more Americans had been vaccinated for COVID-19 than had been infected. But as vaccination rates lagged over the summer, new surges of COVID-19 came. More than 80% of these cases by late July were caused by the Delta variant, which is more contagious than the original virus. This has resulted in growing rates of community transmission and—especially in counties with lower vaccination rates—increasing rates of hospitalization and death.
The United States reached 642,879 COVID-19-related deaths and nearly 39.5 million COVID-19 cases as of Sep. 2, according to Johns Hopkins University.
Currently, 52.7% of the U.S. population is fully vaccinated. Epidemiologists say the lower the vaccination rate, the more the virus has the opportunity to continue to evolve and become more dangerous.
Stacker compiled a list of the counties with the lowest in-patient bed capacity in Alabama using data from the U.S. Department of Health & Human Services. Counties are ranked by the percent of in-patient hospital beds filled as of Sep. 1, with ICU availability serving as a tiebreaker. Hospitalization data was available for about 77% of counties in the U.S. Keep reading to see what hospital capacity looks like in your county.

Canva
#50. Greene County, AL
– Inpatient beds occupied: 39.0% (0.0% by COVID-19 patients)
— 50.6% more availability than Alabama overall
– ICU beds occupied: data not available
— 96% full in Alabama overall
– Cases per 100k in last 7 days: 814 (66 cases)
– Population that is fully vaccinated: 36.9% (2,989 fully vaccinated)
— 49.2% lower vaccination rate than Alabama
Rivers A. Langley; SaveRivers // Wikimedia Commons
#49. Tallapoosa County, AL
– Inpatient beds occupied: 40.0% (10.0% by COVID-19 patients)
— 49.4% more availability than Alabama overall
– ICU beds occupied: 117.0% (61.0% by COVID-19 patients)
— 21.9% more full than Alabama overall
– Cases per 100k in last 7 days: 793 (320 cases)
– Population that is fully vaccinated: 30.4% (12,287 fully vaccinated)
— 58.1% lower vaccination rate than Alabama
JNix // Shutterstock
#48. Clay County, AL
– Inpatient beds occupied: 44.0% (9.0% by COVID-19 patients)
— 44.3% more availability than Alabama overall
– ICU beds occupied: 100.0% (93.0% by COVID-19 patients)
— 4.2% more full than Alabama overall
– Cases per 100k in last 7 days: 1,194 (158 cases)
– Population that is fully vaccinated: 30.4% (4,030 fully vaccinated)
— 58.1% lower vaccination rate than Alabama
Rudi Weikard // Wikimedia Commons
#47. Cherokee County, AL
– Inpatient beds occupied: 44.0% (9.0% by COVID-19 patients)
— 44.3% more availability than Alabama overall
– ICU beds occupied: data not available
— 96% full in Alabama overall
– Cases per 100k in last 7 days: 588 (154 cases)
– Population that is fully vaccinated: 24.5% (6,405 fully vaccinated)
— 66.3% lower vaccination rate than Alabama
Canva
#46. Sumter County, AL
– Inpatient beds occupied: 45.0% (0.0% by COVID-19 patients)
— 43.0% more availability than Alabama overall
– ICU beds occupied: data not available
— 96% full in Alabama overall
– Cases per 100k in last 7 days: 153 (19 cases)
– Population that is fully vaccinated: 36.2% (4,494 fully vaccinated)
— 50.1% lower vaccination rate than Alabama
Carol M. Highsmith // Wikimedia Commons
#45. Monroe County, AL
– Inpatient beds occupied: 46.0% (19.0% by COVID-19 patients)
— 41.8% more availability than Alabama overall
– ICU beds occupied: 89.0% (64.0% by COVID-19 patients)
— 7.3% more availability than Alabama overall
– Cases per 100k in last 7 days: 1,066 (221 cases)
– Population that is fully vaccinated: 30.9% (6,399 fully vaccinated)
— 57.4% lower vaccination rate than Alabama
Rudi Weikard // Wikimedia Commons
#44. Marion County, AL
– Inpatient beds occupied: 47.0% (13.0% by COVID-19 patients)
— 40.5% more availability than Alabama overall
– ICU beds occupied: 93.0% (75.0% by COVID-19 patients)
— 3.1% more availability than Alabama overall
– Cases per 100k in last 7 days: 677 (201 cases)
– Population that is fully vaccinated: 27.6% (8,185 fully vaccinated)
— 62.0% lower vaccination rate than Alabama
Rudi Weikard // Wikimedia Commons
#43. Franklin County, AL
– Inpatient beds occupied: 48.0% (7.0% by COVID-19 patients)
— 39.2% more availability than Alabama overall
– ICU beds occupied: 67.0% (40.0% by COVID-19 patients)
— 30.2% more availability than Alabama overall
– Cases per 100k in last 7 days: 628 (197 cases)
– Population that is fully vaccinated: 33.3% (10,458 fully vaccinated)
— 54.1% lower vaccination rate than Alabama
Canva
#42. Escambia County, AL
– Inpatient beds occupied: 53.0% (20.0% by COVID-19 patients)
— 32.9% more availability than Alabama overall
– ICU beds occupied: 83.0% (74.0% by COVID-19 patients)
— 13.5% more availability than Alabama overall
– Cases per 100k in last 7 days: 598 (219 cases)
– Population that is fully vaccinated: 25.4% (9,290 fully vaccinated)
— 65.0% lower vaccination rate than Alabama
Rivers Langley; SaveRivers // Wikimedia Commons
#41. Crenshaw County, AL
– Inpatient beds occupied: 53.0% (21.0% by COVID-19 patients)
— 32.9% more availability than Alabama overall
– ICU beds occupied: data not available
— 96% full in Alabama overall
– Cases per 100k in last 7 days: 1,038 (143 cases)
– Population that is fully vaccinated: 26.2% (3,605 fully vaccinated)
— 63.9% lower vaccination rate than Alabama
DXR // Wikimedia Commons
#40. Dallas County, AL
– Inpatient beds occupied: 56.0% (15.0% by COVID-19 patients)
— 29.1% more availability than Alabama overall
– ICU beds occupied: 100.0% (42.0% by COVID-19 patients)
— 4.2% more full than Alabama overall
– Cases per 100k in last 7 days: 570 (212 cases)
– Population that is fully vaccinated: 31.3% (11,626 fully vaccinated)
— 56.9% lower vaccination rate than Alabama
Rivers A. Langley; SaveRivers // Wikimedia Commons
#39. Randolph County, AL
– Inpatient beds occupied: 56.0% (5.0% by COVID-19 patients)
— 29.1% more availability than Alabama overall
– ICU beds occupied: data not available
— 96% full in Alabama overall
– Cases per 100k in last 7 days: 898 (204 cases)
– Population that is fully vaccinated: 25.1% (5,713 fully vaccinated)
— 65.4% lower vaccination rate than Alabama
Rivers Langley; SaveRivers // Wikimedia Commons
#38. Chambers County, AL
– Inpatient beds occupied: 60.0% (8.0% by COVID-19 patients)
— 24.1% more availability than Alabama overall
– ICU beds occupied: data not available
— 96% full in Alabama overall
– Cases per 100k in last 7 days: 698 (232 cases)
– Population that is fully vaccinated: 24.0% (7,982 fully vaccinated)
— 66.9% lower vaccination rate than Alabama
Carol M. Highsmith // Wikimedia Commons
#37. Hale County, AL
– Inpatient beds occupied: 66.0% (42.0% by COVID-19 patients)
— 16.5% more availability than Alabama overall
– ICU beds occupied: data not available
— 96% full in Alabama overall
– Cases per 100k in last 7 days: 976 (143 cases)
– Population that is fully vaccinated: 46.9% (6,874 fully vaccinated)
— 35.4% lower vaccination rate than Alabama
Canva
#36. Chilton County, AL
– Inpatient beds occupied: 68.0% (30.0% by COVID-19 patients)
— 13.9% more availability than Alabama overall
– ICU beds occupied: 69.0% (69.0% by COVID-19 patients)
— 28.1% more availability than Alabama overall
– Cases per 100k in last 7 days: 671 (298 cases)
– Population that is fully vaccinated: 26.0% (11,553 fully vaccinated)
— 64.2% lower vaccination rate than Alabama
Wmr36104 // Wikimedia Commons
#35. Geneva County, AL
– Inpatient beds occupied: 68.0% (24.0% by COVID-19 patients)
— 13.9% more availability than Alabama overall
– ICU beds occupied: 90.0% (81.0% by COVID-19 patients)
— 6.3% more availability than Alabama overall
– Cases per 100k in last 7 days: 735 (193 cases)
– Population that is fully vaccinated: 28.7% (7,551 fully vaccinated)
— 60.5% lower vaccination rate than Alabama
Chris Pruitt // Wikimedia Commons
#34. Butler County, AL
– Inpatient beds occupied: 70.0% (32.0% by COVID-19 patients)
— 11.4% more availability than Alabama overall
– ICU beds occupied: 86.0% (59.0% by COVID-19 patients)
— 10.4% more availability than Alabama overall
– Cases per 100k in last 7 days: 617 (120 cases)
– Population that is fully vaccinated: 29.6% (5,765 fully vaccinated)
— 59.2% lower vaccination rate than Alabama
Canva
#33. Walker County, AL
– Inpatient beds occupied: 71.0% (27.0% by COVID-19 patients)
— 10.1% more availability than Alabama overall
– ICU beds occupied: 100.0% (90.0% by COVID-19 patients)
— 4.2% more full than Alabama overall
– Cases per 100k in last 7 days: 641 (407 cases)
– Population that is fully vaccinated: 35.3% (22,454 fully vaccinated)
— 51.4% lower vaccination rate than Alabama
Carol M. Highsmith // Wikimedia Commons
#32. Limestone County, AL
– Inpatient beds occupied: 72.0% (13.0% by COVID-19 patients)
— 8.9% more availability than Alabama overall
– ICU beds occupied: 76.0% (24.0% by COVID-19 patients)
— 20.8% more availability than Alabama overall
– Cases per 100k in last 7 days: 662 (655 cases)
– Population that is fully vaccinated: 28.2% (27,889 fully vaccinated)
— 61.2% lower vaccination rate than Alabama
Canva
#31. Marshall County, AL
– Inpatient beds occupied: 72.0% (28.0% by COVID-19 patients)
— 8.9% more availability than Alabama overall
– ICU beds occupied: 101.0% (68.0% by COVID-19 patients)
— 5.2% more full than Alabama overall
– Cases per 100k in last 7 days: 889 (860 cases)
– Population that is fully vaccinated: 32.7% (31,649 fully vaccinated)
— 55.0% lower vaccination rate than Alabama
Springfieldohio // Wikimedia Commons
#30. Jackson County, AL
– Inpatient beds occupied: 73.0% (19.0% by COVID-19 patients)
— 7.6% more availability than Alabama overall
– ICU beds occupied: 93.0% (49.0% by COVID-19 patients)
— 3.1% more availability than Alabama overall
– Cases per 100k in last 7 days: 612 (316 cases)
– Population that is fully vaccinated: 35.8% (18,493 fully vaccinated)
— 50.7% lower vaccination rate than Alabama
Canva
#29. DeKalb County, AL
– Inpatient beds occupied: 73.0% (17.0% by COVID-19 patients)
— 7.6% more availability than Alabama overall
– ICU beds occupied: 94.0% (58.0% by COVID-19 patients)
— 2.1% more availability than Alabama overall
– Cases per 100k in last 7 days: 652 (466 cases)
– Population that is fully vaccinated: 23.7% (16,979 fully vaccinated)
— 67.4% lower vaccination rate than Alabama
Chris Pruitt // wikicommons
#28. Montgomery County, AL
– Inpatient beds occupied: 73.0% (19.0% by COVID-19 patients)
— 7.6% more availability than Alabama overall
– ICU beds occupied: 96.0% (42.0% by COVID-19 patients)
— 0.0% more availability than Alabama overall
– Cases per 100k in last 7 days: 610 (1,381 cases)
– Population that is fully vaccinated: 39.7% (89,946 fully vaccinated)
— 45.3% lower vaccination rate than Alabama
Rivers Langley; SaveRivers // Wikimedia Commons
#27. Barbour County, AL
– Inpatient beds occupied: 73.0% (17.0% by COVID-19 patients)
— 7.6% more availability than Alabama overall
– ICU beds occupied: 100.0% (51.0% by COVID-19 patients)
— 4.2% more full than Alabama overall
– Cases per 100k in last 7 days: 737 (182 cases)
– Population that is fully vaccinated: 30.8% (7,607 fully vaccinated)
— 57.6% lower vaccination rate than Alabama
Chris Pruitt // Wikimedia Commons
#26. Covington County, AL
– Inpatient beds occupied: 74.0% (27.0% by COVID-19 patients)
— 6.3% more availability than Alabama overall
– ICU beds occupied: 103.0% (62.0% by COVID-19 patients)
— 7.3% more full than Alabama overall
– Cases per 100k in last 7 days: 510 (189 cases)
– Population that is fully vaccinated: 27.5% (10,189 fully vaccinated)
— 62.1% lower vaccination rate than Alabama
Dailynetworks // Wikimedia Commons
#25. Colbert County, AL
– Inpatient beds occupied: 74.0% (16.0% by COVID-19 patients)
— 6.3% more availability than Alabama overall
– ICU beds occupied: data not available
— 96% full in Alabama overall
– Cases per 100k in last 7 days: 514 (284 cases)
– Population that is fully vaccinated: 37.8% (20,902 fully vaccinated)
— 47.9% lower vaccination rate than Alabama
Rivers Langley; SaveRivers // Wikimedia Commons
#24. Talladega County, AL
– Inpatient beds occupied: 77.0% (20.0% by COVID-19 patients)
— 2.5% more availability than Alabama overall
– ICU beds occupied: 97.0% (74.0% by COVID-19 patients)
— 1.0% more full than Alabama overall
– Cases per 100k in last 7 days: 795 (636 cases)
– Population that is fully vaccinated: 28.3% (22,607 fully vaccinated)
— 61.0% lower vaccination rate than Alabama
Chris Pruitt // Wikimedia Commons
#23. Autauga County, AL
– Inpatient beds occupied: 77.0% (31.0% by COVID-19 patients)
— 2.5% more availability than Alabama overall
– ICU beds occupied: 100.0% (45.0% by COVID-19 patients)
— 4.2% more full than Alabama overall
– Cases per 100k in last 7 days: 762 (426 cases)
– Population that is fully vaccinated: 30.2% (16,887 fully vaccinated)
— 58.4% lower vaccination rate than Alabama
Canva
#22. Fayette County, AL
– Inpatient beds occupied: 78.0% (37.0% by COVID-19 patients)
— 1.3% more availability than Alabama overall
– ICU beds occupied: 14.0% (.0% by COVID-19 patients)
— 85.4% more availability than Alabama overall
– Cases per 100k in last 7 days: 337 (55 cases)
– Population that is fully vaccinated: 26.7% (4,348 fully vaccinated)
— 63.2% lower vaccination rate than Alabama
MPearsallArt // Wikimedia Commons
#21. Morgan County, AL
– Inpatient beds occupied: 78.0% (20.0% by COVID-19 patients)
— 1.3% more availability than Alabama overall
– ICU beds occupied: 89.0% (46.0% by COVID-19 patients)
— 7.3% more availability than Alabama overall
– Cases per 100k in last 7 days: 822 (984 cases)
– Population that is fully vaccinated: 33.8% (40,411 fully vaccinated)
— 53.4% lower vaccination rate than Alabama
Tracy Burroughs Brown // Shutterstock
#20. Tuscaloosa County, AL
– Inpatient beds occupied: 78.0% (21.0% by COVID-19 patients)
— 1.3% more availability than Alabama overall
– ICU beds occupied: 99.0% (48.0% by COVID-19 patients)
— 3.1% more full than Alabama overall
– Cases per 100k in last 7 days: 495 (1,036 cases)
– Population that is fully vaccinated: 33.9% (70,885 fully vaccinated)
— 53.3% lower vaccination rate than Alabama
Kreeder13 // Wikimedia Commons
#19. Pike County, AL
– Inpatient beds occupied: 79.0% (18.0% by COVID-19 patients)
— 0.0% more availability than Alabama overall
– ICU beds occupied: 93.0% (60.0% by COVID-19 patients)
— 3.1% more availability than Alabama overall
– Cases per 100k in last 7 days: 637 (211 cases)
– Population that is fully vaccinated: 30.6% (10,146 fully vaccinated)
— 57.9% lower vaccination rate than Alabama
Canva
#18. Marengo County, AL
– Inpatient beds occupied: 80.0% (35.0% by COVID-19 patients)
— 1.3% more full than Alabama overall
– ICU beds occupied: 88.0% (80.0% by COVID-19 patients)
— 8.3% more availability than Alabama overall
– Cases per 100k in last 7 days: 684 (129 cases)
– Population that is fully vaccinated: 40.0% (7,552 fully vaccinated)
— 44.9% lower vaccination rate than Alabama
Rivers Langley SaveRivers // Wikimedia Commons
#17. Russell County, AL
– Inpatient beds occupied: 80.0% (11.0% by COVID-19 patients)
— 1.3% more full than Alabama overall
– ICU beds occupied: 95.0% (52.0% by COVID-19 patients)
— 1.0% more availability than Alabama overall
– Cases per 100k in last 7 days: 416 (241 cases)
– Population that is fully vaccinated: 28.7% (16,630 fully vaccinated)
— 60.5% lower vaccination rate than Alabama
Rudi Weikard // Wikimedia Commons
#16. Blount County, AL
– Inpatient beds occupied: 81.0% (22.0% by COVID-19 patients)
— 2.5% more full than Alabama overall
– ICU beds occupied: 90.0% (55.0% by COVID-19 patients)
— 6.3% more availability than Alabama overall
– Cases per 100k in last 7 days: 730 (422 cases)
– Population that is fully vaccinated: 22.3% (12,904 fully vaccinated)
— 69.3% lower vaccination rate than Alabama
Wayne James // Shutterstock
#15. Lauderdale County, AL
– Inpatient beds occupied: 81.0% (21.0% by COVID-19 patients)
— 2.5% more full than Alabama overall
– ICU beds occupied: 95.0% (43.0% by COVID-19 patients)
— 1.0% more availability than Alabama overall
– Cases per 100k in last 7 days: 591 (548 cases)
– Population that is fully vaccinated: 36.8% (34,123 fully vaccinated)
— 49.3% lower vaccination rate than Alabama
Calvin Beale // Wikimedia Commons
#14. Coffee County, AL
– Inpatient beds occupied: 81.0% (56.0% by COVID-19 patients)
— 2.5% more full than Alabama overall
– ICU beds occupied: 122.0% (111.0% by COVID-19 patients)
— 27.1% more full than Alabama overall
– Cases per 100k in last 7 days: 720 (377 cases)
– Population that is fully vaccinated: 28.7% (15,019 fully vaccinated)
— 60.5% lower vaccination rate than Alabama
Altairisfar // Wikicommons
#13. Mobile County, AL
– Inpatient beds occupied: 82.0% (25.0% by COVID-19 patients)
— 3.8% more full than Alabama overall
– ICU beds occupied: 98.0% (63.0% by COVID-19 patients)
— 2.1% more full than Alabama overall
– Cases per 100k in last 7 days: 793 (3,277 cases)
– Population that is fully vaccinated: 36.4% (150,383 fully vaccinated)
— 49.9% lower vaccination rate than Alabama
M Floyd // Flickr
#12. Jefferson County, AL
– Inpatient beds occupied: 83.0% (14.0% by COVID-19 patients)
— 5.1% more full than Alabama overall
– ICU beds occupied: 94.0% (36.0% by COVID-19 patients)
— 2.1% more availability than Alabama overall
– Cases per 100k in last 7 days: 754 (4,965 cases)
– Population that is fully vaccinated: 44.7% (294,665 fully vaccinated)
— 38.4% lower vaccination rate than Alabama
Rivers Langley; SaveRivers // Wikimedia Commons
#11. Shelby County, AL
– Inpatient beds occupied: 84.0% (21.0% by COVID-19 patients)
— 6.3% more full than Alabama overall
– ICU beds occupied: 92.0% (52.0% by COVID-19 patients)
— 4.2% more availability than Alabama overall
– Cases per 100k in last 7 days: 735 (1,600 cases)
– Population that is fully vaccinated: 27.2% (59,319 fully vaccinated)
— 62.5% lower vaccination rate than Alabama
Chris Pruitt // Wikimedia Commons
#10. Conecuh County, AL
– Inpatient beds occupied: 84.0% (53.0% by COVID-19 patients)
— 6.3% more full than Alabama overall
– ICU beds occupied: data not available
— 96% full in Alabama overall
– Cases per 100k in last 7 days: 845 (102 cases)
– Population that is fully vaccinated: 31.9% (3,851 fully vaccinated)
— 56.1% lower vaccination rate than Alabama
Rivers Langley; SaveRivers // Wikimedia Commons
#9. Calhoun County, AL
– Inpatient beds occupied: 87.0% (17.0% by COVID-19 patients)
— 10.1% more full than Alabama overall
– ICU beds occupied: 96.0% (41.0% by COVID-19 patients)
— 0.0% more availability than Alabama overall
– Cases per 100k in last 7 days: 800 (909 cases)
– Population that is fully vaccinated: 34.4% (39,112 fully vaccinated)
— 52.6% lower vaccination rate than Alabama
Pixabay
#8. Madison County, AL
– Inpatient beds occupied: 87.0% (17.0% by COVID-19 patients)
— 10.1% more full than Alabama overall
– ICU beds occupied: 97.0% (47.0% by COVID-19 patients)
— 1.0% more full than Alabama overall
– Cases per 100k in last 7 days: 636 (2,373 cases)
– Population that is fully vaccinated: 48.0% (178,900 fully vaccinated)
— 33.9% lower vaccination rate than Alabama
Library of Congress
#7. Lee County, AL
– Inpatient beds occupied: 87.0% (28.0% by COVID-19 patients)
— 10.1% more full than Alabama overall
– ICU beds occupied: 104.0% (64.0% by COVID-19 patients)
— 8.3% more full than Alabama overall
– Cases per 100k in last 7 days: 492 (810 cases)
– Population that is fully vaccinated: 31.3% (51,467 fully vaccinated)
— 56.9% lower vaccination rate than Alabama
Prestinian // Wikimedia Commons
#6. Etowah County, AL
– Inpatient beds occupied: 88.0% (29.0% by COVID-19 patients)
— 11.4% more full than Alabama overall
– ICU beds occupied: 98.0% (58.0% by COVID-19 patients)
— 2.1% more full than Alabama overall
– Cases per 100k in last 7 days: 645 (660 cases)
– Population that is fully vaccinated: 30.1% (30,779 fully vaccinated)
— 58.5% lower vaccination rate than Alabama
Michael Rivera // Wikimedia Commons
#5. Dale County, AL
– Inpatient beds occupied: 89.0% (45.0% by COVID-19 patients)
— 12.7% more full than Alabama overall
– ICU beds occupied: 127.0% (120.0% by COVID-19 patients)
— 32.3% more full than Alabama overall
– Cases per 100k in last 7 days: 970 (477 cases)
– Population that is fully vaccinated: 39.8% (19,567 fully vaccinated)
— 45.2% lower vaccination rate than Alabama
Jodybwiki // Wikimedia Commons
#4. Baldwin County, AL
– Inpatient beds occupied: 90.0% (39.0% by COVID-19 patients)
— 13.9% more full than Alabama overall
– ICU beds occupied: 102.0% (63.0% by COVID-19 patients)
— 6.3% more full than Alabama overall
– Cases per 100k in last 7 days: 796 (1,777 cases)
– Population that is fully vaccinated: 37.3% (83,329 fully vaccinated)
— 48.6% lower vaccination rate than Alabama
Carol M. Highsmith/Library of Congress // Wikimedia Commons
#3. Houston County, AL
– Inpatient beds occupied: 97.0% (32.0% by COVID-19 patients)
— 22.8% more full than Alabama overall
– ICU beds occupied: 105.0% (72.0% by COVID-19 patients)
— 9.4% more full than Alabama overall
– Cases per 100k in last 7 days: 635 (672 cases)
– Population that is fully vaccinated: 32.6% (34,482 fully vaccinated)
— 55.1% lower vaccination rate than Alabama
Chris Pruitt // Wikimedia Commons
#2. Cullman County, AL
– Inpatient beds occupied: 97.0% (46.0% by COVID-19 patients)
— 22.8% more full than Alabama overall
– ICU beds occupied: data not available
— 96% full in Alabama overall
– Cases per 100k in last 7 days: 772 (647 cases)
– Population that is fully vaccinated: 29.6% (24,815 fully vaccinated)
— 59.2% lower vaccination rate than Alabama
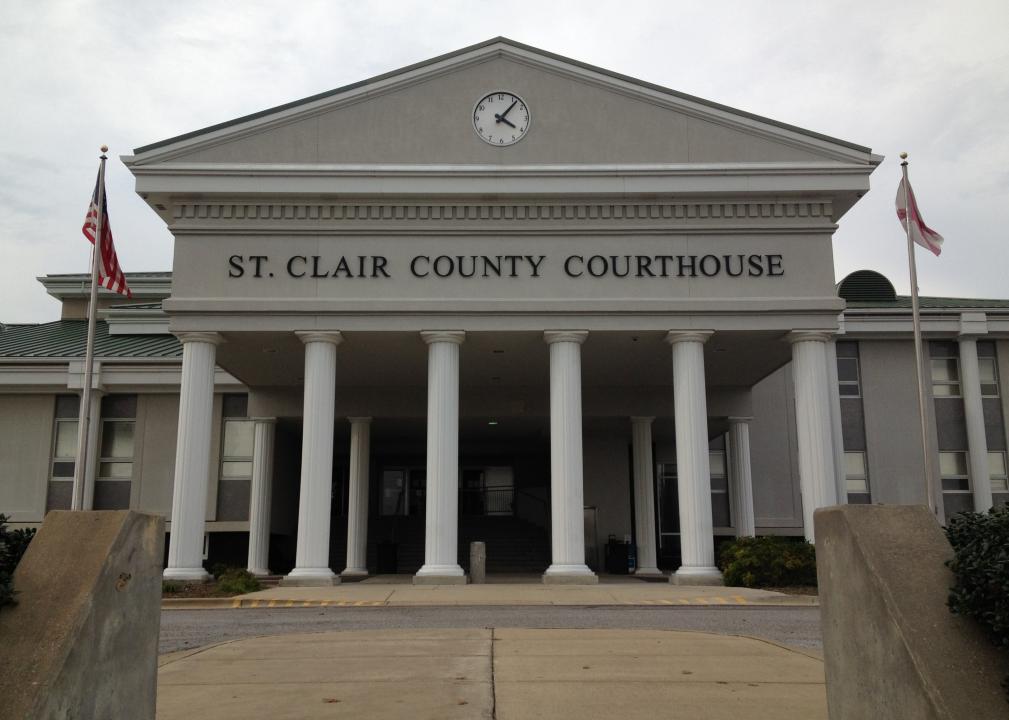
Rudi Weikard // Wikimedia Commons
#1. St. Clair County, AL
– Inpatient beds occupied: 99.0% (54.0% by COVID-19 patients)
— 25.3% more full than Alabama overall
– ICU beds occupied: 100.0% (77.0% by COVID-19 patients)
— 4.2% more full than Alabama overall
– Cases per 100k in last 7 days: 945 (846 cases)
– Population that is fully vaccinated: 29.0% (25,936 fully vaccinated)
— 60.1% lower vaccination rate than Alabama