Counties with the lowest hospital bed capacity in Alabama
Published 6:28 am Friday, August 27, 2021
Rudi Weikard // Wikimedia Commons
Counties with the lowest hospital bed capacity in Alabama
The deployment of vaccines beginning in December signaled a turning point in the pandemic. By Feb. 2,more Americans had been vaccinated for COVID-19 than had been infected. But as vaccination rates lagged over the summer, new surges of COVID-19 came. More than 80% of these cases by late July were caused by the Delta variant, which is more contagious than the original virus. This has resulted in growing rates of community transmission and—especially in counties with lower vaccination rates—increasing rates of hospitalization and death.
The United States reached 632,310 COVID-19-related deaths and nearly 38.2 million COVID-19 cases as of Aug. 26, according to Johns Hopkins University.
Currently, 51.7% of the U.S. population is fully vaccinated. Epidemiologists say the lower the vaccination rate, the more the virus has the opportunity to continue to evolve and become more dangerous.
Stacker compiled a list of the counties with the lowest in-patient bed capacity in Alabama using data from the U.S. Department of Health & Human Services. Counties are ranked by the percent of in-patient hospital beds filled as of August 25, with ICU availability serving as a tiebreaker. Hospitalization data was available for about 77% of counties in the U.S. Keep reading to see what hospital capacity looks like in your county.

Rivers Langley; SaveRivers // Wikimedia Commons
#50. Crenshaw County, AL
– Inpatient beds occupied: 42.0% (11.0% by COVID-19 patients)
— 47.5% more availability than Alabama overall
– ICU beds occupied: data not available
— 96% full in Alabama overall
– Cases per 100k in last 7 days: 661 (91 cases)
– Population that is fully vaccinated: 25.3% (3,484 fully vaccinated)
— 31.3% lower vaccination rate than Alabama
Canva
#49. Bullock County, AL
– Inpatient beds occupied: 42.0% (1.0% by COVID-19 patients)
— 47.5% more availability than Alabama overall
– ICU beds occupied: data not available
— 96% full in Alabama overall
– Cases per 100k in last 7 days: 317 (32 cases)
– Population that is fully vaccinated: 36.8% (3,719 fully vaccinated)
— 0.0% lower vaccination rate than Alabama
Canva
#48. Chilton County, AL
– Inpatient beds occupied: 43.0% (15.0% by COVID-19 patients)
— 46.3% more availability than Alabama overall
– ICU beds occupied: 64.0% (48.0% by COVID-19 patients)
— 33.3% more availability than Alabama overall
– Cases per 100k in last 7 days: 497 (221 cases)
– Population that is fully vaccinated: 24.3% (10,809 fully vaccinated)
— 34.0% lower vaccination rate than Alabama
Rivers A. Langley; SaveRivers // Wikimedia Commons
#47. Randolph County, AL
– Inpatient beds occupied: 43.0% (4.0% by COVID-19 patients)
— 46.3% more availability than Alabama overall
– ICU beds occupied: data not available
— 96% full in Alabama overall
– Cases per 100k in last 7 days: 555 (126 cases)
– Population that is fully vaccinated: 24.4% (5,552 fully vaccinated)
— 33.7% lower vaccination rate than Alabama
Canva
#46. Winston County, AL
– Inpatient beds occupied: 44.0% (10.0% by COVID-19 patients)
— 45.0% more availability than Alabama overall
– ICU beds occupied: data not available
— 96% full in Alabama overall
– Cases per 100k in last 7 days: 631 (149 cases)
– Population that is fully vaccinated: 15.6% (3,695 fully vaccinated)
— 57.6% lower vaccination rate than Alabama
Canva
#45. Sumter County, AL
– Inpatient beds occupied: 44.0% (1.0% by COVID-19 patients)
— 45.0% more availability than Alabama overall
– ICU beds occupied: data not available
— 96% full in Alabama overall
– Cases per 100k in last 7 days: 113 (14 cases)
– Population that is fully vaccinated: 34.8% (4,319 fully vaccinated)
— 5.4% lower vaccination rate than Alabama
Canva
#44. Bibb County, AL
– Inpatient beds occupied: 46.0% (23.0% by COVID-19 patients)
— 42.5% more availability than Alabama overall
– ICU beds occupied: data not available
— 96% full in Alabama overall
– Cases per 100k in last 7 days: 688 (154 cases)
– Population that is fully vaccinated: 24.5% (5,477 fully vaccinated)
— 33.4% lower vaccination rate than Alabama
Rivers A. Langley; SaveRivers // Wikimedia Commons
#43. Tallapoosa County, AL
– Inpatient beds occupied: 47.0% (12.0% by COVID-19 patients)
— 41.3% more availability than Alabama overall
– ICU beds occupied: 133.0% (100.0% by COVID-19 patients)
— 38.5% more full than Alabama overall
– Cases per 100k in last 7 days: 547 (221 cases)
– Population that is fully vaccinated: 29.4% (11,883 fully vaccinated)
— 20.1% lower vaccination rate than Alabama
Rudi Weikard // Wikimedia Commons
#42. Marion County, AL
– Inpatient beds occupied: 50.0% (15.0% by COVID-19 patients)
— 37.5% more availability than Alabama overall
– ICU beds occupied: 92.0% (88.0% by COVID-19 patients)
— 4.2% more availability than Alabama overall
– Cases per 100k in last 7 days: 444 (132 cases)
– Population that is fully vaccinated: 26.3% (7,807 fully vaccinated)
— 28.5% lower vaccination rate than Alabama
Rudi Weikard // Wikimedia Commons
#41. Franklin County, AL
– Inpatient beds occupied: 56.0% (12.0% by COVID-19 patients)
— 30.0% more availability than Alabama overall
– ICU beds occupied: 67.0% (36.0% by COVID-19 patients)
— 30.2% more availability than Alabama overall
– Cases per 100k in last 7 days: 415 (130 cases)
– Population that is fully vaccinated: 31.5% (9,870 fully vaccinated)
— 14.4% lower vaccination rate than Alabama
Rivers Langley; SaveRivers // Wikimedia Commons
#40. Chambers County, AL
– Inpatient beds occupied: 57.0% (10.0% by COVID-19 patients)
— 28.8% more availability than Alabama overall
– ICU beds occupied: data not available
— 96% full in Alabama overall
– Cases per 100k in last 7 days: 535 (178 cases)
– Population that is fully vaccinated: 22.8% (7,570 fully vaccinated)
— 38.0% lower vaccination rate than Alabama
DXR // Wikimedia Commons
#39. Dallas County, AL
– Inpatient beds occupied: 58.0% (12.0% by COVID-19 patients)
— 27.5% more availability than Alabama overall
– ICU beds occupied: 100.0% (51.0% by COVID-19 patients)
— 4.2% more full than Alabama overall
– Cases per 100k in last 7 days: 304 (113 cases)
– Population that is fully vaccinated: 30.0% (11,176 fully vaccinated)
— 18.5% lower vaccination rate than Alabama
Rudi Weikard // Wikimedia Commons
#38. Blount County, AL
– Inpatient beds occupied: 60.0% (12.0% by COVID-19 patients)
— 25.0% more availability than Alabama overall
– ICU beds occupied: 52.0% (17.0% by COVID-19 patients)
— 45.8% more availability than Alabama overall
– Cases per 100k in last 7 days: 500 (289 cases)
– Population that is fully vaccinated: 20.9% (12,088 fully vaccinated)
— 43.2% lower vaccination rate than Alabama
Canva
#37. Greene County, AL
– Inpatient beds occupied: 61.0% (0.0% by COVID-19 patients)
— 23.8% more availability than Alabama overall
– ICU beds occupied: data not available
— 96% full in Alabama overall
– Cases per 100k in last 7 days: 468 (38 cases)
– Population that is fully vaccinated: 35.7% (2,897 fully vaccinated)
— 3.0% lower vaccination rate than Alabama
Canva
#36. Escambia County, AL
– Inpatient beds occupied: 62.0% (30.0% by COVID-19 patients)
— 22.5% more availability than Alabama overall
– ICU beds occupied: 93.0% (89.0% by COVID-19 patients)
— 3.1% more availability than Alabama overall
– Cases per 100k in last 7 days: 871 (319 cases)
– Population that is fully vaccinated: 24.0% (8,802 fully vaccinated)
— 34.8% lower vaccination rate than Alabama
Carol M. Highsmith // Wikimedia Commons
#35. Monroe County, AL
– Inpatient beds occupied: 65.0% (26.0% by COVID-19 patients)
— 18.8% more availability than Alabama overall
– ICU beds occupied: 108.0% (79.0% by COVID-19 patients)
— 12.5% more full than Alabama overall
– Cases per 100k in last 7 days: 883 (183 cases)
– Population that is fully vaccinated: 29.2% (6,049 fully vaccinated)
— 20.7% lower vaccination rate than Alabama
Dailynetworks // Wikimedia Commons
#34. Colbert County, AL
– Inpatient beds occupied: 69.0% (16.0% by COVID-19 patients)
— 13.8% more availability than Alabama overall
– ICU beds occupied: data not available
— 96% full in Alabama overall
– Cases per 100k in last 7 days: 342 (189 cases)
– Population that is fully vaccinated: 36.5% (20,136 fully vaccinated)
— 0.8% lower vaccination rate than Alabama
Wmr36104 // Wikimedia Commons
#33. Geneva County, AL
– Inpatient beds occupied: 70.0% (30.0% by COVID-19 patients)
— 12.5% more availability than Alabama overall
– ICU beds occupied: 105.0% (81.0% by COVID-19 patients)
— 9.4% more full than Alabama overall
– Cases per 100k in last 7 days: 780 (205 cases)
– Population that is fully vaccinated: 27.6% (7,240 fully vaccinated)
— 25.0% lower vaccination rate than Alabama
Springfieldohio // Wikimedia Commons
#32. Jackson County, AL
– Inpatient beds occupied: 71.0% (21.0% by COVID-19 patients)
— 11.3% more availability than Alabama overall
– ICU beds occupied: 96.0% (73.0% by COVID-19 patients)
— 0.0% more availability than Alabama overall
– Cases per 100k in last 7 days: 372 (192 cases)
– Population that is fully vaccinated: 34.3% (17,707 fully vaccinated)
— 6.8% lower vaccination rate than Alabama
Canva
#31. DeKalb County, AL
– Inpatient beds occupied: 72.0% (19.0% by COVID-19 patients)
— 10.0% more availability than Alabama overall
– ICU beds occupied: 82.0% (52.0% by COVID-19 patients)
— 14.6% more availability than Alabama overall
– Cases per 100k in last 7 days: 420 (300 cases)
– Population that is fully vaccinated: 22.7% (16,210 fully vaccinated)
— 38.3% lower vaccination rate than Alabama
Rivers Langley; SaveRivers // Wikimedia Commons
#30. Talladega County, AL
– Inpatient beds occupied: 72.0% (16.0% by COVID-19 patients)
— 10.0% more availability than Alabama overall
– ICU beds occupied: 98.0% (78.0% by COVID-19 patients)
— 2.1% more full than Alabama overall
– Cases per 100k in last 7 days: 575 (460 cases)
– Population that is fully vaccinated: 27.1% (21,683 fully vaccinated)
— 26.4% lower vaccination rate than Alabama
Canva
#29. Fayette County, AL
– Inpatient beds occupied: 73.0% (37.0% by COVID-19 patients)
— 8.8% more availability than Alabama overall
– ICU beds occupied: 14.0% (.0% by COVID-19 patients)
— 85.4% more availability than Alabama overall
– Cases per 100k in last 7 days: 350 (57 cases)
– Population that is fully vaccinated: 25.4% (4,135 fully vaccinated)
— 31.0% lower vaccination rate than Alabama
MPearsallArt // Wikimedia Commons
#28. Morgan County, AL
– Inpatient beds occupied: 74.0% (15.0% by COVID-19 patients)
— 7.5% more availability than Alabama overall
– ICU beds occupied: 100.0% (36.0% by COVID-19 patients)
— 4.2% more full than Alabama overall
– Cases per 100k in last 7 days: 394 (471 cases)
– Population that is fully vaccinated: 32.7% (39,113 fully vaccinated)
— 11.1% lower vaccination rate than Alabama
Canva
#27. Walker County, AL
– Inpatient beds occupied: 74.0% (23.0% by COVID-19 patients)
— 7.5% more availability than Alabama overall
– ICU beds occupied: 100.0% (57.0% by COVID-19 patients)
— 4.2% more full than Alabama overall
– Cases per 100k in last 7 days: 512 (325 cases)
– Population that is fully vaccinated: 33.8% (21,482 fully vaccinated)
— 8.2% lower vaccination rate than Alabama
Kreeder13 // Wikimedia Commons
#26. Pike County, AL
– Inpatient beds occupied: 74.0% (17.0% by COVID-19 patients)
— 7.5% more availability than Alabama overall
– ICU beds occupied: data not available
— 96% full in Alabama overall
– Cases per 100k in last 7 days: 495 (164 cases)
– Population that is fully vaccinated: 29.4% (9,721 fully vaccinated)
— 20.1% lower vaccination rate than Alabama
Carol M. Highsmith // Wikimedia Commons
#25. Limestone County, AL
– Inpatient beds occupied: 75.0% (11.0% by COVID-19 patients)
— 6.3% more availability than Alabama overall
– ICU beds occupied: 93.0% (54.0% by COVID-19 patients)
— 3.1% more availability than Alabama overall
– Cases per 100k in last 7 days: 381 (377 cases)
– Population that is fully vaccinated: 27.0% (26,718 fully vaccinated)
— 26.6% lower vaccination rate than Alabama
Chris Pruitt // Wikimedia Commons
#24. Butler County, AL
– Inpatient beds occupied: 75.0% (38.0% by COVID-19 patients)
— 6.3% more availability than Alabama overall
– ICU beds occupied: 96.0% (69.0% by COVID-19 patients)
— 0.0% more availability than Alabama overall
– Cases per 100k in last 7 days: 463 (90 cases)
– Population that is fully vaccinated: 28.6% (5,567 fully vaccinated)
— 22.3% lower vaccination rate than Alabama
Chris Pruitt // wikicommons
#23. Montgomery County, AL
– Inpatient beds occupied: 77.0% (18.0% by COVID-19 patients)
— 3.8% more availability than Alabama overall
– ICU beds occupied: 96.0% (35.0% by COVID-19 patients)
— 0.0% more availability than Alabama overall
– Cases per 100k in last 7 days: 378 (857 cases)
– Population that is fully vaccinated: 38.4% (86,899 fully vaccinated)
— 4.3% higher vaccination rate than Alabama
Canva
#22. Marshall County, AL
– Inpatient beds occupied: 78.0% (31.0% by COVID-19 patients)
— 2.5% more availability than Alabama overall
– ICU beds occupied: 100.0% (75.0% by COVID-19 patients)
— 4.2% more full than Alabama overall
– Cases per 100k in last 7 days: 567 (549 cases)
– Population that is fully vaccinated: 31.1% (30,079 fully vaccinated)
— 15.5% lower vaccination rate than Alabama
Rivers Langley; SaveRivers // Wikimedia Commons
#21. Barbour County, AL
– Inpatient beds occupied: 78.0% (10.0% by COVID-19 patients)
— 2.5% more availability than Alabama overall
– ICU beds occupied: 100.0% (40.0% by COVID-19 patients)
— 4.2% more full than Alabama overall
– Cases per 100k in last 7 days: 377 (93 cases)
– Population that is fully vaccinated: 29.6% (7,318 fully vaccinated)
— 19.6% lower vaccination rate than Alabama
Chris Pruitt // Wikimedia Commons
#20. Covington County, AL
– Inpatient beds occupied: 81.0% (26.0% by COVID-19 patients)
— 1.3% more full than Alabama overall
– ICU beds occupied: 91.0% (60.0% by COVID-19 patients)
— 5.2% more availability than Alabama overall
– Cases per 100k in last 7 days: 664 (246 cases)
– Population that is fully vaccinated: 26.0% (9,619 fully vaccinated)
— 29.3% lower vaccination rate than Alabama
Calvin Beale // Wikimedia Commons
#19. Coffee County, AL
– Inpatient beds occupied: 81.0% (55.0% by COVID-19 patients)
— 1.3% more full than Alabama overall
– ICU beds occupied: 111.0% (111.0% by COVID-19 patients)
— 15.6% more full than Alabama overall
– Cases per 100k in last 7 days: 541 (283 cases)
– Population that is fully vaccinated: 26.8% (14,023 fully vaccinated)
— 27.2% lower vaccination rate than Alabama
Altairisfar // Wikicommons
#18. Mobile County, AL
– Inpatient beds occupied: 82.0% (27.0% by COVID-19 patients)
— 2.5% more full than Alabama overall
– ICU beds occupied: 94.0% (70.0% by COVID-19 patients)
— 2.1% more availability than Alabama overall
– Cases per 100k in last 7 days: 650 (2,684 cases)
– Population that is fully vaccinated: 34.3% (141,846 fully vaccinated)
— 6.8% lower vaccination rate than Alabama
Tracy Burroughs Brown // Shutterstock
#17. Tuscaloosa County, AL
– Inpatient beds occupied: 82.0% (19.0% by COVID-19 patients)
— 2.5% more full than Alabama overall
– ICU beds occupied: 101.0% (41.0% by COVID-19 patients)
— 5.2% more full than Alabama overall
– Cases per 100k in last 7 days: 260 (545 cases)
– Population that is fully vaccinated: 32.6% (68,172 fully vaccinated)
— 11.4% lower vaccination rate than Alabama
M Floyd // Flickr
#16. Jefferson County, AL
– Inpatient beds occupied: 83.0% (13.0% by COVID-19 patients)
— 3.7% more full than Alabama overall
– ICU beds occupied: 94.0% (36.0% by COVID-19 patients)
— 2.1% more availability than Alabama overall
– Cases per 100k in last 7 days: 501 (3,301 cases)
– Population that is fully vaccinated: 43.0% (283,028 fully vaccinated)
— 16.8% higher vaccination rate than Alabama
Rivers Langley; SaveRivers // Wikimedia Commons
#15. Calhoun County, AL
– Inpatient beds occupied: 83.0% (16.0% by COVID-19 patients)
— 3.7% more full than Alabama overall
– ICU beds occupied: 94.0% (38.0% by COVID-19 patients)
— 2.1% more availability than Alabama overall
– Cases per 100k in last 7 days: 477 (542 cases)
– Population that is fully vaccinated: 33.0% (37,447 fully vaccinated)
— 10.3% lower vaccination rate than Alabama
Chris Pruitt // Wikimedia Commons
#14. Autauga County, AL
– Inpatient beds occupied: 83.0% (33.0% by COVID-19 patients)
— 3.7% more full than Alabama overall
– ICU beds occupied: 100.0% (69.0% by COVID-19 patients)
— 4.2% more full than Alabama overall
– Cases per 100k in last 7 days: 431 (241 cases)
– Population that is fully vaccinated: 28.6% (15,955 fully vaccinated)
— 22.3% lower vaccination rate than Alabama
Chris Pruitt // Wikimedia Commons
#13. Conecuh County, AL
– Inpatient beds occupied: 83.0% (48.0% by COVID-19 patients)
— 3.7% more full than Alabama overall
– ICU beds occupied: data not available
— 96% full in Alabama overall
– Cases per 100k in last 7 days: 738 (89 cases)
– Population that is fully vaccinated: 30.5% (3,676 fully vaccinated)
— 17.1% lower vaccination rate than Alabama
Rivers Langley; SaveRivers // Wikimedia Commons
#12. Shelby County, AL
– Inpatient beds occupied: 84.0% (22.0% by COVID-19 patients)
— 5.0% more full than Alabama overall
– ICU beds occupied: 93.0% (53.0% by COVID-19 patients)
— 3.1% more availability than Alabama overall
– Cases per 100k in last 7 days: 441 (960 cases)
– Population that is fully vaccinated: 26.1% (56,896 fully vaccinated)
— 29.1% lower vaccination rate than Alabama
Canva
#11. Marengo County, AL
– Inpatient beds occupied: 85.0% (30.0% by COVID-19 patients)
— 6.2% more full than Alabama overall
– ICU beds occupied: 95.0% (77.0% by COVID-19 patients)
— 1.0% more availability than Alabama overall
– Cases per 100k in last 7 days: 456 (86 cases)
– Population that is fully vaccinated: 38.2% (7,201 fully vaccinated)
— 3.8% higher vaccination rate than Alabama
Pixabay
#10. Madison County, AL
– Inpatient beds occupied: 86.0% (14.0% by COVID-19 patients)
— 7.5% more full than Alabama overall
– ICU beds occupied: 97.0% (42.0% by COVID-19 patients)
— 1.0% more full than Alabama overall
– Cases per 100k in last 7 days: 408 (1,523 cases)
– Population that is fully vaccinated: 46.5% (173,519 fully vaccinated)
— 26.4% higher vaccination rate than Alabama
Wayne James // Shutterstock
#9. Lauderdale County, AL
– Inpatient beds occupied: 86.0% (19.0% by COVID-19 patients)
— 7.5% more full than Alabama overall
– ICU beds occupied: 99.0% (54.0% by COVID-19 patients)
— 3.1% more full than Alabama overall
– Cases per 100k in last 7 days: 399 (370 cases)
– Population that is fully vaccinated: 35.5% (32,924 fully vaccinated)
— 3.5% lower vaccination rate than Alabama
Jodybwiki // Wikimedia Commons
#8. Baldwin County, AL
– Inpatient beds occupied: 89.0% (42.0% by COVID-19 patients)
— 11.3% more full than Alabama overall
– ICU beds occupied: 104.0% (73.0% by COVID-19 patients)
— 8.3% more full than Alabama overall
– Cases per 100k in last 7 days: 828 (1,848 cases)
– Population that is fully vaccinated: 34.7% (77,516 fully vaccinated)
— 5.7% lower vaccination rate than Alabama
Rivers Langley SaveRivers // Wikimedia Commons
#7. Russell County, AL
– Inpatient beds occupied: 91.0% (14.0% by COVID-19 patients)
— 13.8% more full than Alabama overall
– ICU beds occupied: 98.0% (43.0% by COVID-19 patients)
— 2.1% more full than Alabama overall
– Cases per 100k in last 7 days: 250 (145 cases)
– Population that is fully vaccinated: 27.7% (16,036 fully vaccinated)
— 24.7% lower vaccination rate than Alabama
Library of Congress
#6. Lee County, AL
– Inpatient beds occupied: 91.0% (26.0% by COVID-19 patients)
— 13.8% more full than Alabama overall
– ICU beds occupied: 100.0% (73.0% by COVID-19 patients)
— 4.2% more full than Alabama overall
– Cases per 100k in last 7 days: 437 (719 cases)
– Population that is fully vaccinated: 30.4% (49,992 fully vaccinated)
— 17.4% lower vaccination rate than Alabama
Prestinian // Wikimedia Commons
#5. Etowah County, AL
– Inpatient beds occupied: 91.0% (28.0% by COVID-19 patients)
— 13.8% more full than Alabama overall
– ICU beds occupied: 100.0% (42.0% by COVID-19 patients)
— 4.2% more full than Alabama overall
– Cases per 100k in last 7 days: 420 (430 cases)
– Population that is fully vaccinated: 28.8% (29,448 fully vaccinated)
— 21.7% lower vaccination rate than Alabama
Michael Rivera // Wikimedia Commons
#4. Dale County, AL
– Inpatient beds occupied: 93.0% (57.0% by COVID-19 patients)
— 16.3% more full than Alabama overall
– ICU beds occupied: 107.0% (93.0% by COVID-19 patients)
— 11.5% more full than Alabama overall
– Cases per 100k in last 7 days: 785 (386 cases)
– Population that is fully vaccinated: 38.4% (18,867 fully vaccinated)
— 4.3% higher vaccination rate than Alabama
Chris Pruitt // Wikimedia Commons
#3. Cullman County, AL
– Inpatient beds occupied: 93.0% (36.0% by COVID-19 patients)
— 16.3% more full than Alabama overall
– ICU beds occupied: 109.0% (82.0% by COVID-19 patients)
— 13.5% more full than Alabama overall
– Cases per 100k in last 7 days: 524 (439 cases)
– Population that is fully vaccinated: 28.4% (23,821 fully vaccinated)
— 22.8% lower vaccination rate than Alabama
Carol M. Highsmith/Library of Congress // Wikimedia Commons
#2. Houston County, AL
– Inpatient beds occupied: 96.0% (31.0% by COVID-19 patients)
— 20.0% more full than Alabama overall
– ICU beds occupied: 108.0% (79.0% by COVID-19 patients)
— 12.5% more full than Alabama overall
– Cases per 100k in last 7 days: 512 (542 cases)
– Population that is fully vaccinated: 31.1% (32,961 fully vaccinated)
— 15.5% lower vaccination rate than Alabama
Rudi Weikard // Wikimedia Commons
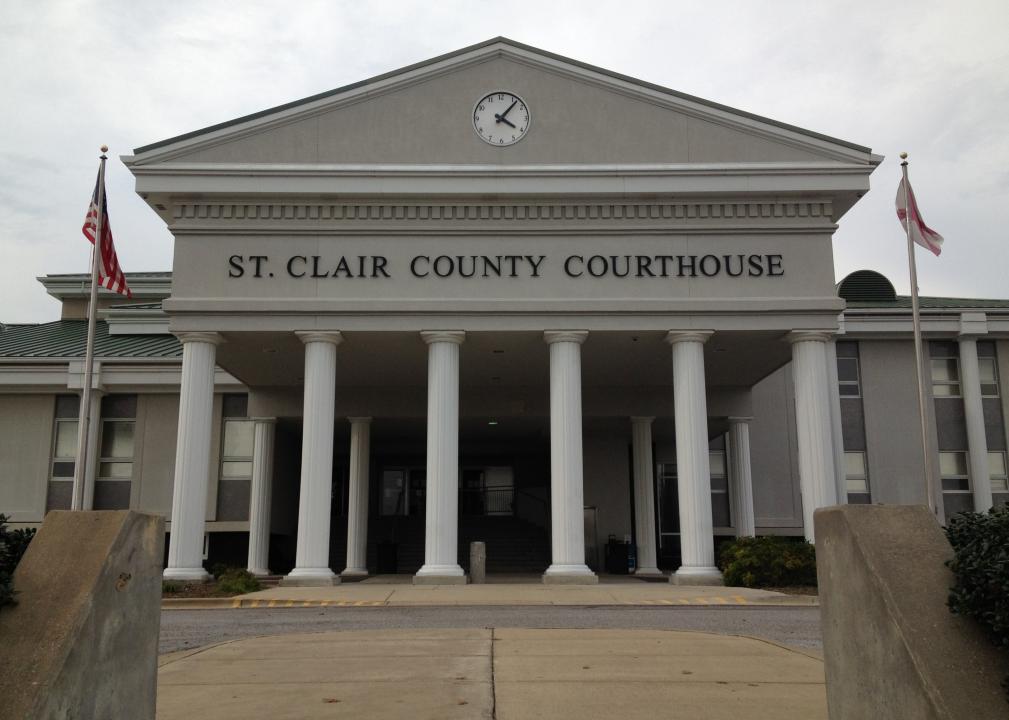
#1. St. Clair County, AL
– Inpatient beds occupied: 99.0% (40.0% by COVID-19 patients)
— 23.8% more full than Alabama overall
– ICU beds occupied: 100.0% (62.0% by COVID-19 patients)
— 4.2% more full than Alabama overall
– Cases per 100k in last 7 days: 652 (584 cases)
– Population that is fully vaccinated: 27.7% (24,772 fully vaccinated)
— 24.7% lower vaccination rate than Alabama