Think you know where the most diverse counties in Alabama are? Think again. Check our list here.
Published 11:47 am Tuesday, June 15, 2021
Rivers Langley; SaveRivers // Wikimedia Commons
Most diverse counties in Alabama
The United States has a longstanding reputation as being a melting pot (or salad bowl), with its diversity manifesting itself across many different demographics. However, some places across the country are notably more heterogeneous than others.
Stacker compiled a list of the most diverse counties in Alabama using data from using data from the U.S. Census Bureau. Counties are ranked by the highest Simpson’s diversity index score. Simpson’s diversity index measures community diversity on a scale of 0 (least diverse) to 1 (most diverse), more on the calculation can be read here.
Think you know which counties in your home state might be the most diverse? Keep reading to see if your predictions are correct.
You may also like: Where people in Alabama are moving to most

Mccallk69 // Shutterstock
#50. Macon County
– Index: 0.282
– Total population: 18,708
– White: 16.0% (3,000)
– Black or African American: 83.2% (15,560)
– American Indian and Alaska Native: 0.1% (16)
– Asian: 0.2% (32)
– Native Hawaiian and other Pacific Islander: 0.0% (0)
– 2 or more races: 0.5% (89)
– Some other Race: 0.1% (11)
JNix // Shutterstock
#49. Clay County
– Index: 0.284
– Total population: 13,337
– White: 83.2% (11,092)
– Black or African American: 15.6% (2,075)
– American Indian and Alaska Native: 0.3% (37)
– Asian: 0.2% (21)
– Native Hawaiian and other Pacific Islander: 0.0% (0)
– 2 or more races: 0.7% (94)
– Some other Race: 0.1% (18)
Canva
#48. Chilton County
– Index: 0.291
– Total population: 44,055
– White: 83.6% (36,835)
– Black or African American: 9.2% (4,041)
– American Indian and Alaska Native: 0.8% (361)
– Asian: 0.4% (195)
– Native Hawaiian and other Pacific Islander: 0.0% (0)
– 2 or more races: 2.5% (1,093)
– Some other Race: 3.5% (1,530)
Rudi Weikard // Wikimedia Commons
#47. Franklin County
– Index: 0.299
– Total population: 31,466
– White: 83.0% (26,118)
– Black or African American: 4.4% (1,385)
– American Indian and Alaska Native: 1.3% (408)
– Asian: 0.4% (117)
– Native Hawaiian and other Pacific Islander: 0.0% (0)
– 2 or more races: 1.3% (408)
– Some other Race: 9.6% (3,030)
Carol M. Highsmith // Wikimedia Commons
#46. Limestone County
– Index: 0.336
– Total population: 94,727
– White: 80.2% (76,003)
– Black or African American: 13.8% (13,028)
– American Indian and Alaska Native: 0.8% (723)
– Asian: 1.4% (1,309)
– Native Hawaiian and other Pacific Islander: 0.1% (78)
– 2 or more races: 1.8% (1,727)
– Some other Race: 2.0% (1,859)
You may also like: Fastest-growing counties in Alabama

Prestinian // Wikimedia Commons
#45. Etowah County
– Index: 0.337
– Total population: 102,748
– White: 79.8% (82,027)
– Black or African American: 15.9% (16,330)
– American Indian and Alaska Native: 0.6% (581)
– Asian: 0.7% (764)
– Native Hawaiian and other Pacific Islander: 0.0% (24)
– 2 or more races: 1.8% (1,841)
– Some other Race: 1.1% (1,181)
Canva
#44. Greene County
– Index: 0.337
– Total population: 8,324
– White: 17.3% (1,439)
– Black or African American: 79.5% (6,618)
– American Indian and Alaska Native: 0.4% (37)
– Asian: 0.0% (0)
– Native Hawaiian and other Pacific Islander: 0.0% (0)
– 2 or more races: 2.7% (222)
– Some other Race: 0.1% (8)
Rivers Langley; SaveRivers // Wikimedia Commons
#43. Shelby County
– Index: 0.341
– Total population: 213,432
– White: 80.1% (170,998)
– Black or African American: 12.1% (25,878)
– American Indian and Alaska Native: 0.3% (736)
– Asian: 2.1% (4,399)
– Native Hawaiian and other Pacific Islander: 0.0% (51)
– 2 or more races: 2.0% (4,274)
– Some other Race: 3.3% (7,096)
MPearsallArt // Wikimedia Commons
#42. Morgan County
– Index: 0.343
– Total population: 119,213
– White: 79.9% (95,265)
– Black or African American: 12.8% (15,230)
– American Indian and Alaska Native: 0.5% (574)
– Asian: 0.6% (760)
– Native Hawaiian and other Pacific Islander: 0.1% (91)
– 2 or more races: 2.2% (2,681)
– Some other Race: 3.9% (4,612)
Dailynetworks // Wikimedia Commons
#41. Colbert County
– Index: 0.348
– Total population: 54,771
– White: 79.0% (43,289)
– Black or African American: 16.2% (8,872)
– American Indian and Alaska Native: 0.6% (319)
– Asian: 0.5% (259)
– Native Hawaiian and other Pacific Islander: 0.1% (51)
– 2 or more races: 2.0% (1,115)
– Some other Race: 1.6% (866)
You may also like: Highest-earning counties in Alabama

Canva
#40. Bibb County
– Index: 0.361
– Total population: 22,493
– White: 76.8% (17,272)
– Black or African American: 22.3% (5,014)
– American Indian and Alaska Native: 0.1% (30)
– Asian: 0.1% (27)
– Native Hawaiian and other Pacific Islander: 0.0% (0)
– 2 or more races: 0.6% (141)
– Some other Race: 0.0% (9)
Rivers A. Langley; SaveRivers // Wikimedia Commons
#39. Randolph County
– Index: 0.364
– Total population: 22,647
– White: 77.1% (17,452)
– Black or African American: 20.4% (4,622)
– American Indian and Alaska Native: 0.2% (38)
– Asian: 0.2% (47)
– Native Hawaiian and other Pacific Islander: 0.0% (0)
– 2 or more races: 1.8% (405)
– Some other Race: 0.4% (83)
Chris Pruitt // Wikimedia Commons
#38. Autauga County
– Index: 0.373
– Total population: 55,380
– White: 76.8% (42,527)
– Black or African American: 19.0% (10,538)
– American Indian and Alaska Native: 0.3% (140)
– Asian: 1.0% (573)
– Native Hawaiian and other Pacific Islander: 0.0% (26)
– 2 or more races: 2.2% (1,198)
– Some other Race: 0.7% (378)
Canva
#37. Lawrence County
– Index: 0.374
– Total population: 33,058
– White: 78.0% (25,799)
– Black or African American: 10.6% (3,502)
– American Indian and Alaska Native: 5.6% (1,852)
– Asian: 0.2% (65)
– Native Hawaiian and other Pacific Islander: 0.1% (27)
– 2 or more races: 5.2% (1,715)
– Some other Race: 0.3% (98)
Altairisfar // Wikimedia Commons
#36. Lowndes County
– Index: 0.382
– Total population: 10,079
– White: 24.8% (2,497)
– Black or African American: 74.6% (7,522)
– American Indian and Alaska Native: 0.1% (13)
– Asian: 0.0% (0)
– Native Hawaiian and other Pacific Islander: 0.0% (0)
– 2 or more races: 0.5% (47)
– Some other Race: 0.0% (0)
You may also like: Counties with the most college graduates in Alabama

Rivers A. Langley; SaveRivers // Wikimedia Commons
#35. Elmore County
– Index: 0.386
– Total population: 81,144
– White: 75.3% (61,104)
– Black or African American: 21.5% (17,449)
– American Indian and Alaska Native: 0.3% (214)
– Asian: 0.5% (439)
– Native Hawaiian and other Pacific Islander: 0.0% (0)
– 2 or more races: 1.7% (1,349)
– Some other Race: 0.7% (589)
Canva
#34. Bullock County
– Index: 0.392
– Total population: 10,248
– White: 21.9% (2,244)
– Black or African American: 74.8% (7,666)
– American Indian and Alaska Native: 0.0% (0)
– Asian: 0.5% (50)
– Native Hawaiian and other Pacific Islander: 0.0% (0)
– 2 or more races: 0.8% (78)
– Some other Race: 2.0% (210)
Calvin Beale // Wikimedia Commons
#33. Coffee County
– Index: 0.396
– Total population: 51,662
– White: 75.7% (39,118)
– Black or African American: 16.9% (8,733)
– American Indian and Alaska Native: 1.2% (640)
– Asian: 1.4% (745)
– Native Hawaiian and other Pacific Islander: 0.0% (0)
– 2 or more races: 3.3% (1,730)
– Some other Race: 1.3% (696)
Rivers Langley; SaveRivers // Wikimedia Commons
#32. Calhoun County
– Index: 0.413
– Total population: 114,618
– White: 73.7% (84,439)
– Black or African American: 20.8% (23,830)
– American Indian and Alaska Native: 0.3% (379)
– Asian: 0.9% (1,014)
– Native Hawaiian and other Pacific Islander: 0.0% (14)
– 2 or more races: 2.4% (2,740)
– Some other Race: 1.9% (2,202)
Canva
#31. Sumter County
– Index: 0.419
– Total population: 12,797
– White: 25.2% (3,229)
– Black or African American: 71.9% (9,204)
– American Indian and Alaska Native: 0.1% (9)
– Asian: 2.1% (274)
– Native Hawaiian and other Pacific Islander: 0.0% (0)
– 2 or more races: 0.2% (31)
– Some other Race: 0.4% (50)
You may also like: Biggest sources of immigrants to Alabama

DXR // Wikimedia Commons
#30. Dallas County
– Index: 0.422
– Total population: 39,149
– White: 27.9% (10,906)
– Black or African American: 70.7% (27,693)
– American Indian and Alaska Native: 0.1% (37)
– Asian: 0.6% (222)
– Native Hawaiian and other Pacific Islander: 0.1% (21)
– 2 or more races: 0.6% (243)
– Some other Race: 0.1% (27)
Canva
#29. Perry County
– Index: 0.425
– Total population: 9,293
– White: 29.5% (2,737)
– Black or African American: 69.8% (6,491)
– American Indian and Alaska Native: 0.0% (3)
– Asian: 0.1% (8)
– Native Hawaiian and other Pacific Islander: 0.0% (0)
– 2 or more races: 0.0% (0)
– Some other Race: 0.6% (54)
Rivers Langley; SaveRivers // Wikimedia Commons
#28. Henry County
– Index: 0.429
– Total population: 17,133
– White: 70.7% (12,118)
– Black or African American: 26.6% (4,565)
– American Indian and Alaska Native: 0.2% (30)
– Asian: 0.4% (68)
– Native Hawaiian and other Pacific Islander: 0.1% (17)
– 2 or more races: 1.2% (201)
– Some other Race: 0.8% (134)
Michael Rivera // Wikimedia Commons
#27. Dale County
– Index: 0.434
– Total population: 49,277
– White: 72.4% (35,655)
– Black or African American: 20.3% (10,000)
– American Indian and Alaska Native: 0.8% (386)
– Asian: 1.4% (699)
– Native Hawaiian and other Pacific Islander: 0.0% (4)
– 2 or more races: 3.3% (1,620)
– Some other Race: 1.9% (913)
Rivers A. Langley; SaveRivers // Wikimedia Commons
#26. Tallapoosa County
– Index: 0.435
– Total population: 40,541
– White: 70.0% (28,360)
– Black or African American: 27.4% (11,123)
– American Indian and Alaska Native: 0.2% (90)
– Asian: 0.4% (145)
– Native Hawaiian and other Pacific Islander: 0.0% (0)
– 2 or more races: 1.3% (517)
– Some other Race: 0.8% (306)
You may also like: States sending the most people to Alabama

Rivers Langley; SaveRivers // Wikimedia Commons
#25. Crenshaw County
– Index: 0.435
– Total population: 13,844
– White: 71.4% (9,879)
– Black or African American: 23.3% (3,228)
– American Indian and Alaska Native: 0.7% (97)
– Asian: 1.3% (175)
– Native Hawaiian and other Pacific Islander: 0.1% (9)
– 2 or more races: 3.1% (434)
– Some other Race: 0.2% (22)
Canva
#24. Wilcox County
– Index: 0.443
– Total population: 10,681
– White: 27.3% (2,915)
– Black or African American: 69.4% (7,410)
– American Indian and Alaska Native: 0.2% (19)
– Asian: 0.0% (3)
– Native Hawaiian and other Pacific Islander: 0.0% (0)
– 2 or more races: 3.1% (334)
– Some other Race: 0.0% (0)
Carol M. Highsmith/Library of Congress // Wikimedia Commons
#23. Houston County
– Index: 0.450
– Total population: 104,702
– White: 69.1% (72,344)
– Black or African American: 26.9% (28,157)
– American Indian and Alaska Native: 0.3% (271)
– Asian: 0.9% (930)
– Native Hawaiian and other Pacific Islander: 0.1% (63)
– 2 or more races: 2.2% (2,303)
– Some other Race: 0.6% (634)
Library of Congress
#22. Lee County
– Index: 0.451
– Total population: 161,152
– White: 70.3% (113,359)
– Black or African American: 22.9% (36,920)
– American Indian and Alaska Native: 0.2% (296)
– Asian: 4.3% (6,899)
– Native Hawaiian and other Pacific Islander: 0.0% (23)
– 2 or more races: 1.9% (3,012)
– Some other Race: 0.4% (643)
Rivers A. Langley; SaveRivers // Wikimedia Commons
#21. Coosa County
– Index: 0.454
– Total population: 10,757
– White: 65.8% (7,078)
– Black or African American: 33.6% (3,615)
– American Indian and Alaska Native: 0.1% (9)
– Asian: 0.0% (0)
– Native Hawaiian and other Pacific Islander: 0.0% (0)
– 2 or more races: 0.0% (0)
– Some other Race: 0.5% (55)
You may also like: Counties with the most super commuters in Alabama

Pixabay
#20. Madison County
– Index: 0.478
– Total population: 362,276
– White: 67.9% (246,132)
– Black or African American: 24.3% (88,011)
– American Indian and Alaska Native: 0.6% (2,124)
– Asian: 2.6% (9,555)
– Native Hawaiian and other Pacific Islander: 0.1% (316)
– 2 or more races: 3.1% (11,199)
– Some other Race: 1.4% (4,939)
Rivers Langley; SaveRivers // Wikimedia Commons
#19. Talladega County
– Index: 0.484
– Total population: 80,387
– White: 63.9% (51,398)
– Black or African American: 32.6% (26,215)
– American Indian and Alaska Native: 0.4% (342)
– Asian: 0.6% (494)
– Native Hawaiian and other Pacific Islander: 0.1% (90)
– 2 or more races: 1.7% (1,338)
– Some other Race: 0.6% (510)
Tracy Burroughs Brown // Shutterstock
#18. Tuscaloosa County
– Index: 0.485
– Total population: 207,305
– White: 64.2% (133,130)
– Black or African American: 32.0% (66,307)
– American Indian and Alaska Native: 0.2% (448)
– Asian: 1.6% (3,341)
– Native Hawaiian and other Pacific Islander: 0.0% (93)
– 2 or more races: 1.1% (2,200)
– Some other Race: 0.9% (1,786)
Carol M. Highsmith // Wikimedia Commons
#17. Hale County
– Index: 0.491
– Total population: 14,809
– White: 39.5% (5,854)
– Black or African American: 59.4% (8,796)
– American Indian and Alaska Native: 0.2% (30)
– Asian: 0.2% (33)
– Native Hawaiian and other Pacific Islander: 0.0% (0)
– 2 or more races: 0.4% (64)
– Some other Race: 0.2% (32)
RuralSWAlabama (Billy Milstead) // Wikimedia Commons
#16. Choctaw County
– Index: 0.497
– Total population: 12,925
– White: 56.8% (7,337)
– Black or African American: 42.6% (5,500)
– American Indian and Alaska Native: 0.1% (8)
– Asian: 0.1% (17)
– Native Hawaiian and other Pacific Islander: 0.0% (0)
– 2 or more races: 0.4% (51)
– Some other Race: 0.1% (12)
You may also like: Highest-rated Class of 2021 football recruits from Alabama

Idawriter // Wikimedia Commons
#15. Washington County
– Index: 0.499
– Total population: 16,541
– White: 66.3% (10,972)
– Black or African American: 23.5% (3,894)
– American Indian and Alaska Native: 7.4% (1,221)
– Asian: 0.3% (42)
– Native Hawaiian and other Pacific Islander: 0.0% (0)
– 2 or more races: 2.4% (397)
– Some other Race: 0.1% (15)
Canva
#14. Marengo County
– Index: 0.504
– Total population: 19,321
– White: 45.8% (8,840)
– Black or African American: 53.6% (10,348)
– American Indian and Alaska Native: 0.1% (21)
– Asian: 0.0% (0)
– Native Hawaiian and other Pacific Islander: 0.0% (0)
– 2 or more races: 0.4% (84)
– Some other Race: 0.1% (28)
Canva
#13. Escambia County
– Index: 0.509
– Total population: 37,057
– White: 62.2% (23,053)
– Black or African American: 32.1% (11,878)
– American Indian and Alaska Native: 4.0% (1,479)
– Asian: 0.3% (102)
– Native Hawaiian and other Pacific Islander: 0.1% (55)
– 2 or more races: 1.0% (382)
– Some other Race: 0.3% (108)
Altairisfar // Wikimedia Commons
#12. Clarke County
– Index: 0.510
– Total population: 24,128
– White: 53.0% (12,781)
– Black or African American: 45.8% (11,044)
– American Indian and Alaska Native: 0.1% (26)
– Asian: 0.4% (104)
– Native Hawaiian and other Pacific Islander: 0.0% (0)
– 2 or more races: 0.7% (173)
– Some other Race: 0.0% (0)
Rivers Langley; SaveRivers // Wikimedia Commons
#11. Chambers County
– Index: 0.510
– Total population: 33,660
– White: 57.7% (19,423)
– Black or African American: 39.6% (13,316)
– American Indian and Alaska Native: 0.3% (112)
– Asian: 1.1% (376)
– Native Hawaiian and other Pacific Islander: 0.0% (0)
– 2 or more races: 1.0% (342)
– Some other Race: 0.3% (91)
You may also like: Recipes from Alabama

Chris Pruitt // Wikimedia Commons
#10. Conecuh County
– Index: 0.515
– Total population: 12,394
– White: 50.7% (6,287)
– Black or African American: 47.8% (5,919)
– American Indian and Alaska Native: 0.2% (25)
– Asian: 0.5% (56)
– Native Hawaiian and other Pacific Islander: 0.0% (0)
– 2 or more races: 0.8% (105)
– Some other Race: 0.0% (2)
Public Domain
#9. Pickens County
– Index: 0.517
– Total population: 20,243
– White: 56.7% (11,477)
– Black or African American: 40.2% (8,134)
– American Indian and Alaska Native: 0.1% (28)
– Asian: 0.1% (12)
– Native Hawaiian and other Pacific Islander: 0.1% (12)
– 2 or more races: 1.5% (302)
– Some other Race: 1.4% (278)
Carol M. Highsmith // Wikimedia Commons
#8. Monroe County
– Index: 0.523
– Total population: 21,270
– White: 54.5% (11,587)
– Black or African American: 42.4% (9,026)
– American Indian and Alaska Native: 1.7% (372)
– Asian: 0.3% (58)
– Native Hawaiian and other Pacific Islander: 0.0% (6)
– 2 or more races: 0.9% (199)
– Some other Race: 0.1% (22)
Chris Pruitt // Wikimedia Commons
#7. Butler County
– Index: 0.525
– Total population: 19,828
– White: 51.8% (10,280)
– Black or African American: 45.4% (9,001)
– American Indian and Alaska Native: 0.1% (11)
– Asian: 0.3% (69)
– Native Hawaiian and other Pacific Islander: 0.0% (0)
– 2 or more races: 2.1% (425)
– Some other Race: 0.2% (42)
Altairisfar // Wikicommons
#6. Mobile County
– Index: 0.528
– Total population: 414,114
– White: 58.6% (242,715)
– Black or African American: 35.8% (148,050)
– American Indian and Alaska Native: 0.8% (3,192)
– Asian: 1.9% (7,928)
– Native Hawaiian and other Pacific Islander: 0.0% (47)
– 2 or more races: 1.8% (7,640)
– Some other Race: 1.1% (4,542)
You may also like: Counties with the worst commutes in Alabama

Kreeder13 // Wikimedia Commons
#5. Pike County
– Index: 0.528
– Total population: 33,333
– White: 57.9% (19,301)
– Black or African American: 36.8% (12,277)
– American Indian and Alaska Native: 0.6% (188)
– Asian: 2.2% (734)
– Native Hawaiian and other Pacific Islander: 0.0% (3)
– 2 or more races: 2.4% (807)
– Some other Race: 0.1% (23)
Chris Pruitt // wikicommons
#4. Montgomery County
– Index: 0.535
– Total population: 226,941
– White: 35.8% (81,265)
– Black or African American: 57.9% (131,408)
– American Indian and Alaska Native: 0.2% (468)
– Asian: 2.8% (6,383)
– Native Hawaiian and other Pacific Islander: 0.0% (53)
– 2 or more races: 1.9% (4,260)
– Some other Race: 1.4% (3,104)
M Floyd // Flickr
#3. Jefferson County
– Index: 0.546
– Total population: 659,680
– White: 51.8% (341,768)
– Black or African American: 42.9% (283,311)
– American Indian and Alaska Native: 0.2% (1,443)
– Asian: 1.6% (10,433)
– Native Hawaiian and other Pacific Islander: 0.0% (201)
– 2 or more races: 1.7% (10,914)
– Some other Race: 1.8% (11,610)
Rivers Langley; SaveRivers // Wikimedia Commons
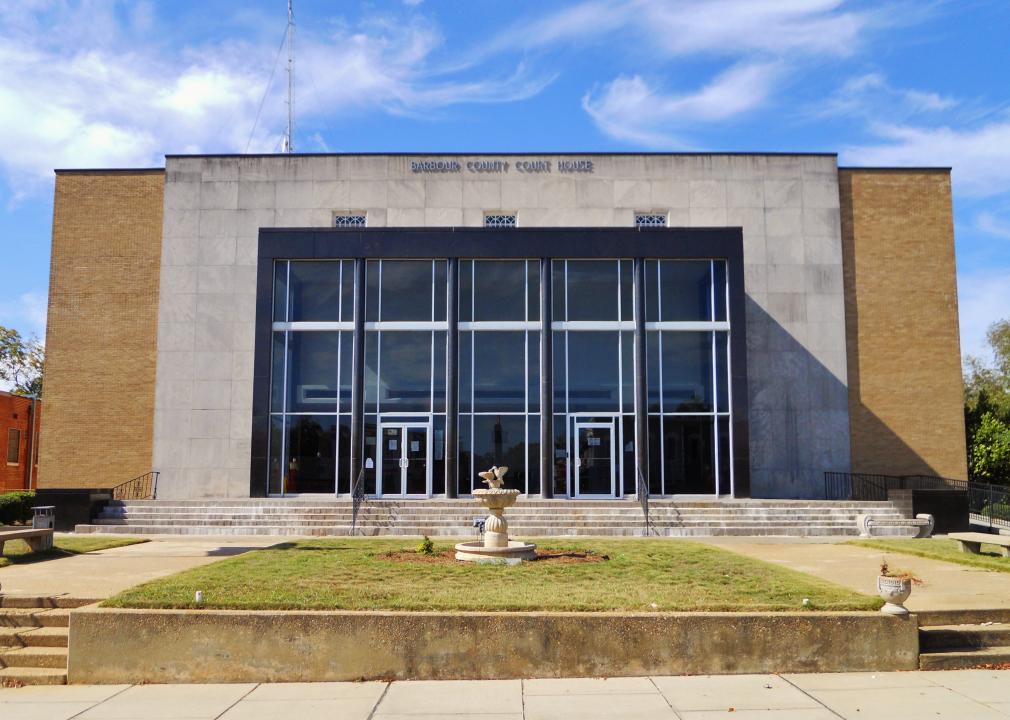
#2. Barbour County
– Index: 0.553
– Total population: 25,361
– White: 46.8% (11,869)
– Black or African American: 47.6% (12,066)
– American Indian and Alaska Native: 0.3% (82)
– Asian: 0.5% (134)
– Native Hawaiian and other Pacific Islander: 0.0% (1)
– 2 or more races: 1.2% (304)
– Some other Race: 3.6% (905)
Rivers Langley SaveRivers // Wikimedia Commons
#1. Russell County
– Index: 0.565
– Total population: 57,952
– White: 49.2% (28,519)
– Black or African American: 43.7% (25,300)
– American Indian and Alaska Native: 0.3% (179)
– Asian: 1.0% (553)
– Native Hawaiian and other Pacific Islander: 0.0% (23)
– 2 or more races: 3.6% (2,088)
– Some other Race: 2.2% (1,290)
You may also like: Highest-rated specialty museums in Alabama, according to Tripadvisor