Counties with the most super commuters in Alabama
Published 12:12 pm Tuesday, June 1, 2021
Rivers Langley; SaveRivers // Wikimedia Commons
Counties with the most super commuters in Alabama
There are more than 281 million vehicles on the road in the United States, and many of those cars, trucks, vans, and motorcycles are used to ferry people to and from their homes and jobs during their daily commutes. A small but growing number of people are walking and biking to work, particularly in compact college towns. Many more take public transportation, especially in major cities like New York, Chicago, San Francisco, Washington D.C., Boston, and Seattle—but nationwide, public transit accounts for only about 5% of daily commutes.
The overwhelming majority of people still drive to and from work every day, and the vast majority of those car commuters drive alone—fewer than 10% of Americans carpool. According to the U.S. Census Bureau, the average one-way commute in the United States has grown to a record 27.1 minutes. That’s just shy of an hour a day that average Americans squander behind the wheel, not at home with their families, and instead, burning gas and putting miles on their cars.
For some Americans, however, the commute to work is far from average. A phenomenon known as super commuting has emerged and grown in recent years. Super commuters spend 90 minutes or more—each way—chasing their paychecks every day. The biggest percentage of super commuters work in the extraction industry, with workers pursuing lucrative jobs in remote mines, oil fields, and other energy operations. Many more, however, have been priced out of expensive housing in urban metro areas where high-paying jobs are located, far away from their less-expensive county of residence.
Stacker compiled a list of counties with the most super commuters in Alabama using data from the U.S. Census Bureau. Counties are ranked by highest percent of workers with a commute over 90 minutes, based on 2019 5-year estimates. Keep reading to see where in your state people are spending the most time going to and from work every day.

Rivers Langley; SaveRivers // Wikimedia Commons
#30. Henry County
– Workers with 90+ minute commute: 2.67%
— #1,226 most common among all counties nationwide
— 38.5% more common than state average
— 8.1% less common than national average
– Average commute time: 28 minutes
— #699 longest among all counties nationwide
— 12.4% longer than state average
— 1.4% longer than national average

Canva
#29. Fayette County
– Workers with 90+ minute commute: 2.71%
— #1,199 most common among all counties nationwide
— 40.5% more common than state average
— 6.8% less common than national average
– Average commute time: 29.8 minutes
— #464 longest among all counties nationwide
— 19.7% longer than state average
— 8.0% longer than national average

Prestinian // Wikimedia Commons
#28. Etowah County
– Workers with 90+ minute commute: 2.71%
— #1,198 most common among all counties nationwide
— 40.5% more common than state average
— 6.7% less common than national average
– Average commute time: 24 minutes
— #1,486 longest among all counties nationwide
— 3.6% shorter than state average
— 13.0% shorter than national average

Canva
#27. Bullock County
– Workers with 90+ minute commute: 2.71%
— #1,195 most common among all counties nationwide
— 40.7% more common than state average
— 6.6% less common than national average
– Average commute time: 27.2 minutes
— #829 longest among all counties nationwide
— 9.2% longer than state average
— 1.4% shorter than national average

DXR // Wikimedia Commons
#26. Dallas County
– Workers with 90+ minute commute: 2.78%
— #1,156 most common among all counties nationwide
— 44.0% more common than state average
— 4.4% less common than national average
– Average commute time: 23.8 minutes
— #1,539 longest among all counties nationwide
— 4.4% shorter than state average
— 13.8% shorter than national average

Rivers A. Langley; SaveRivers // Wikimedia Commons
#25. Randolph County
– Workers with 90+ minute commute: 2.90%
— #1,071 most common among all counties nationwide
— 50.4% more common than state average
— 0.1% less common than national average
– Average commute time: 27.9 minutes
— #724 longest among all counties nationwide
— 12.0% longer than state average
— 1.1% longer than national average

Canva
#24. Marshall County
– Workers with 90+ minute commute: 2.90%
— #1,069 most common among all counties nationwide
— 50.7% more common than state average
— 0.0% more common than national average
– Average commute time: 24.6 minutes
— #1,335 longest among all counties nationwide
— 1.2% shorter than state average
— 10.9% shorter than national average

Canva
#23. Walker County
– Workers with 90+ minute commute: 2.93%
— #1,055 most common among all counties nationwide
— 52.0% more common than state average
— 0.9% more common than national average
– Average commute time: 28.4 minutes
— #642 longest among all counties nationwide
— 14.1% longer than state average
— 2.9% longer than national average

Altairisfar // Wikimedia Commons
#22. Clarke County
– Workers with 90+ minute commute: 3.16%
— #934 most common among all counties nationwide
— 64.1% more common than state average
— 8.9% more common than national average
– Average commute time: 26.6 minutes
— #934 longest among all counties nationwide
— 6.8% longer than state average
— 3.6% shorter than national average

Canva
#21. Marengo County
– Workers with 90+ minute commute: 3.24%
— #900 most common among all counties nationwide
— 68.1% more common than state average
— 11.6% more common than national average
– Average commute time: 24.4 minutes
— #1,392 longest among all counties nationwide
— 2.0% shorter than state average
— 11.6% shorter than national average

Chris Pruitt // Wikimedia Commons
#20. Cullman County
– Workers with 90+ minute commute: 3.31%
— #858 most common among all counties nationwide
— 71.7% more common than state average
— 14.0% more common than national average
– Average commute time: 26.5 minutes
— #954 longest among all counties nationwide
— 6.4% longer than state average
— 4.0% shorter than national average

Canva
#19. Wilcox County
– Workers with 90+ minute commute: 3.33%
— #844 most common among all counties nationwide
— 72.8% more common than state average
— 14.7% more common than national average
– Average commute time: 27.1 minutes
— #846 longest among all counties nationwide
— 8.8% longer than state average
— 1.8% shorter than national average

Rivers Langley; SaveRivers // Wikimedia Commons
#18. Crenshaw County
– Workers with 90+ minute commute: 3.43%
— #797 most common among all counties nationwide
— 77.9% more common than state average
— 18.1% more common than national average
– Average commute time: 29.9 minutes
— #454 longest among all counties nationwide
— 20.1% longer than state average
— 8.3% longer than national average

Rudi Weikard // Wikimedia Commons
#17. Franklin County
– Workers with 90+ minute commute: 3.43%
— #796 most common among all counties nationwide
— 78.0% more common than state average
— 18.2% more common than national average
– Average commute time: 28.8 minutes
— #594 longest among all counties nationwide
— 15.7% longer than state average
— 4.3% longer than national average

Rudi Weikard // Wikimedia Commons
#16. Marion County
– Workers with 90+ minute commute: 3.46%
— #784 most common among all counties nationwide
— 79.7% more common than state average
— 19.3% more common than national average
– Average commute time: 24.4 minutes
— #1,392 longest among all counties nationwide
— 2.0% shorter than state average
— 11.6% shorter than national average

Rudi Weikard // Wikimedia Commons
#15. Cherokee County
– Workers with 90+ minute commute: 3.50%
— #764 most common among all counties nationwide
— 81.8% more common than state average
— 20.7% more common than national average
– Average commute time: 29.5 minutes
— #492 longest among all counties nationwide
— 18.5% longer than state average
— 6.9% longer than national average

Rivers A. Langley; SaveRivers // Wikimedia Commons
#14. Tallapoosa County
– Workers with 90+ minute commute: 3.75%
— #674 most common among all counties nationwide
— 94.7% more common than state average
— 29.3% more common than national average
– Average commute time: 28 minutes
— #699 longest among all counties nationwide
— 12.4% longer than state average
— 1.4% longer than national average

Canva
#13. Sumter County
– Workers with 90+ minute commute: 3.85%
— #643 most common among all counties nationwide
— 99.7% more common than state average
— 32.6% more common than national average
– Average commute time: 26 minutes
— #1,044 longest among all counties nationwide
— 4.4% longer than state average
— 5.8% shorter than national average

Public Domain
#12. Pickens County
– Workers with 90+ minute commute: 3.96%
— #598 most common among all counties nationwide
— 105.5% more common than state average
— 36.4% more common than national average
– Average commute time: 33.2 minutes
— #183 longest among all counties nationwide
— 33.3% longer than state average
— 20.3% longer than national average

Chris Pruitt // Wikimedia Commons
#11. Covington County
– Workers with 90+ minute commute: 4.45%
— #466 most common among all counties nationwide
— 130.9% more common than state average
— 53.3% more common than national average
– Average commute time: 25 minutes
— #1,241 longest among all counties nationwide
— 0.4% longer than state average
— 9.4% shorter than national average

Chris Pruitt // Wikimedia Commons
#10. Conecuh County
– Workers with 90+ minute commute: 4.54%
— #450 most common among all counties nationwide
— 135.6% more common than state average
— 56.4% more common than national average
– Average commute time: 27.9 minutes
— #724 longest among all counties nationwide
— 12.0% longer than state average
— 1.1% longer than national average

Idawriter // Wikimedia Commons
#9. Washington County
– Workers with 90+ minute commute: 4.67%
— #429 most common among all counties nationwide
— 142.4% more common than state average
— 60.9% more common than national average
– Average commute time: 33.4 minutes
— #171 longest among all counties nationwide
— 34.1% longer than state average
— 21.0% longer than national average

JNix // Shutterstock
#8. Clay County
– Workers with 90+ minute commute: 4.99%
— #367 most common among all counties nationwide
— 158.6% more common than state average
— 71.7% more common than national average
– Average commute time: 29.1 minutes
— #548 longest among all counties nationwide
— 16.9% longer than state average
— 5.4% longer than national average

Canva
#7. Perry County
– Workers with 90+ minute commute: 5.24%
— #322 most common among all counties nationwide
— 171.8% more common than state average
— 80.4% more common than national average
– Average commute time: 25.7 minutes
— #1,109 longest among all counties nationwide
— 3.2% longer than state average
— 6.9% shorter than national average

Wmr36104 // Wikimedia Commons
#6. Geneva County
– Workers with 90+ minute commute: 5.26%
— #314 most common among all counties nationwide
— 172.9% more common than state average
— 81.2% more common than national average
– Average commute time: 27.8 minutes
— #741 longest among all counties nationwide
— 11.6% longer than state average
— 0.7% longer than national average

Carol M. Highsmith // Wikimedia Commons
#5. Monroe County
– Workers with 90+ minute commute: 5.35%
— #300 most common among all counties nationwide
— 177.6% more common than state average
— 84.3% more common than national average
– Average commute time: 24.8 minutes
— #1,289 longest among all counties nationwide
— 0.4% shorter than state average
— 10.1% shorter than national average

RuralSWAlabama (Billy Milstead) // Wikimedia Commons
#4. Choctaw County
– Workers with 90+ minute commute: 6.35%
— #176 most common among all counties nationwide
— 229.7% more common than state average
— 118.9% more common than national average
– Average commute time: 34.5 minutes
— #118 longest among all counties nationwide
— 38.6% longer than state average
— 25.0% longer than national average

Canva
#3. Winston County
– Workers with 90+ minute commute: 6.96%
— #136 most common among all counties nationwide
— 261.2% more common than state average
— 139.8% more common than national average
– Average commute time: 31.4 minutes
— #307 longest among all counties nationwide
— 26.1% longer than state average
— 13.8% longer than national average

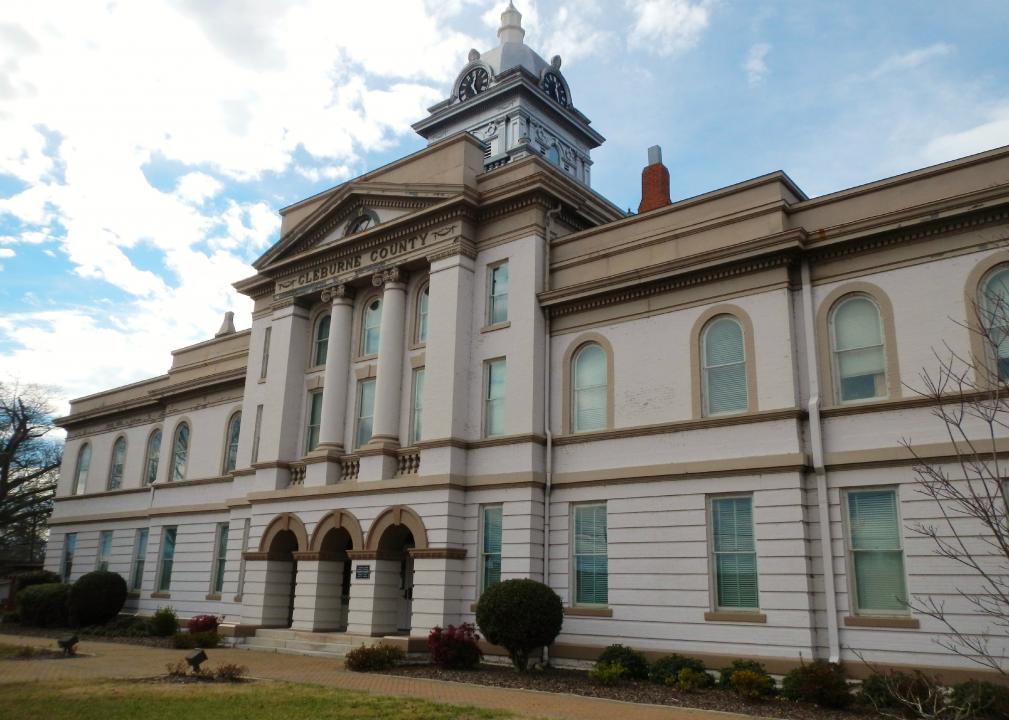
Rivers Langley; SaveRivers // Wikimedia Commons
#2. Cleburne County
– Workers with 90+ minute commute: 7.49%
— #103 most common among all counties nationwide
— 288.6% more common than state average
— 158.0% more common than national average
– Average commute time: 34 minutes
— #138 longest among all counties nationwide
— 36.5% longer than state average
— 23.2% longer than national average

Canva
#1. Greene County
– Workers with 90+ minute commute: 8.31%
— #81 most common among all counties nationwide
— 331.2% more common than state average
— 186.3% more common than national average
– Average commute time: 35.2 minutes
— #95 longest among all counties nationwide
— 41.4% longer than state average
— 27.5% longer than national average